The C-suite to the brokerage “boiler room” floor! – Freight Forecasting

Freight Forecasting with Michael Vincent

In this episode of Freight Forecasting, host Michael Vincent and FreightWaves’Lead Economist Anthony Smith explore the most important freight data points and macro data sets to navigate the freight markets – whether you work on a brokerage floor or in the C-suite!

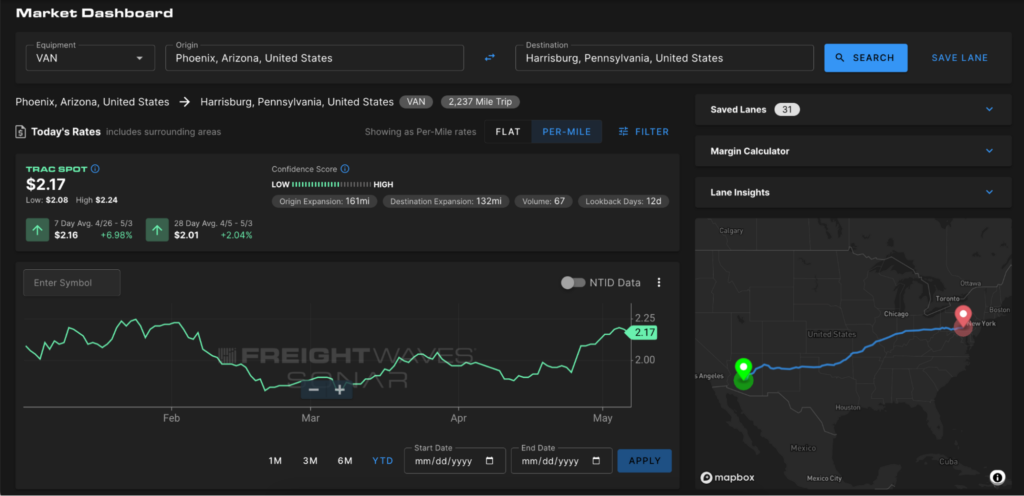
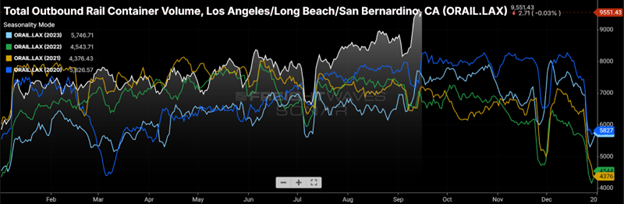
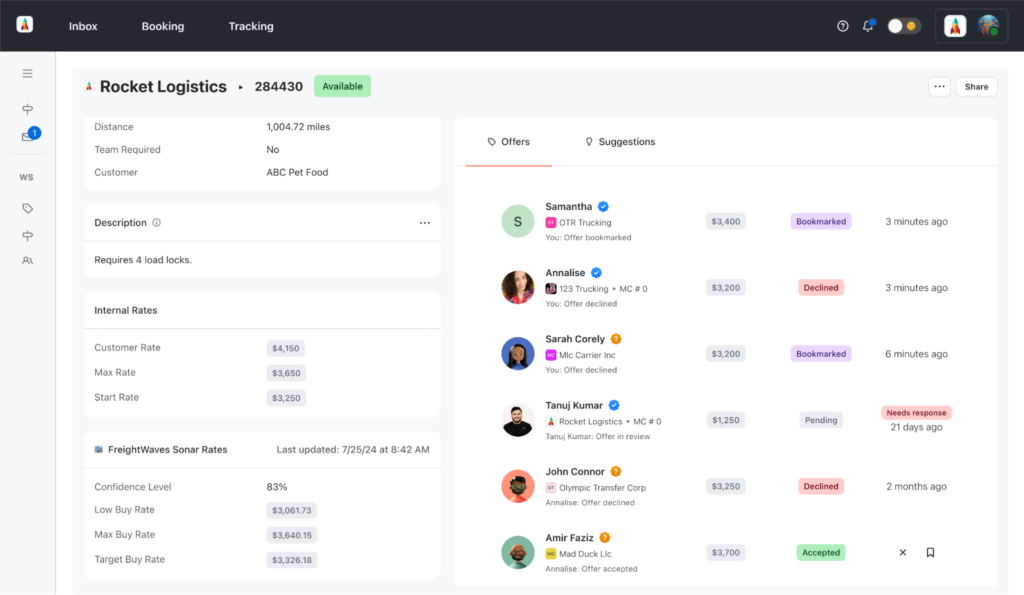
Michael and Anthony look at the five “must have” SONAR dashboards. While SONAR has billions of freight data points and can provide information from the local to the global level, there are key data sets that almost every SONAR user will rely on. They cover the data sets and SONAR features that give every user the insight to take immediate tactical action, as well as to conduct short-term, mid-term and long-term strategic planning.

Know more, faster – and find just what you need with SONAR!

Watch the episode below:

Related Posts

#WithSONAR

Riding the Roller Coaster of Freight (w/ video)

#WithSONAR

#WithSONAR – We Told You So (w/ video)

#WithSONAR

How Shippers Can Reduce Network Risk (w/ video)

Search

What's the SONAR ROI?

By increasing the number of loaded miles per day your drivers drive by 1% and your rate per mile by $0.03 you will make more per week #WithSONAR.

#WithSONAR you can save up to per week through better bid negotiations and more effective management of your routing guide.

#WithSonar you can add 1 more load per person each day and increase $5 margin per load, earning your company an extra per week.

Disclaimer: Every company’s circumstances are unique. Fixed and variable expenses, market conditions and operational factors vary. Unforeseen events may also affect results. Calculated potential results reflect the consensus expectation of FreightWaves’ experts. Actual results may vary.

Read Recent Posts

May 30, 2023

How supply chain leaders can be the CFO’s hero

May 24, 2023

Predicting the next turn in the freight cycle

May 22, 2023

How long does it take the freight market to flip?