The Logistics Managers Index (LMI) is an important barometer for understanding the trends and dynamics within the logistics industry. Created through a collaboration between Arizona State University, Colorado State University, Rutgers University and the Council of Supply Chain Management Professionals (CSCMP), the LMI offers valuable insights by aggregating data from supply chain professionals across the United States. This data is used to track movements in key areas of logistics, providing an up-to-date view of the sector’s health and direction.
Overview of the LMI
The LMI is composed of eight key metrics: inventory levels, inventory costs, warehousing capacity, warehousing utilization, warehousing prices, transportation capacity, transportation utilization and transportation prices. Each of these components is indexed, with a reading above 50 indicating expansion while readings below 50 signal contraction. The LMI, therefore, not only serves as a snapshot of current conditions, but also offers predictive power for future trends in the logistics sector.
Transportation Capacity and Prices
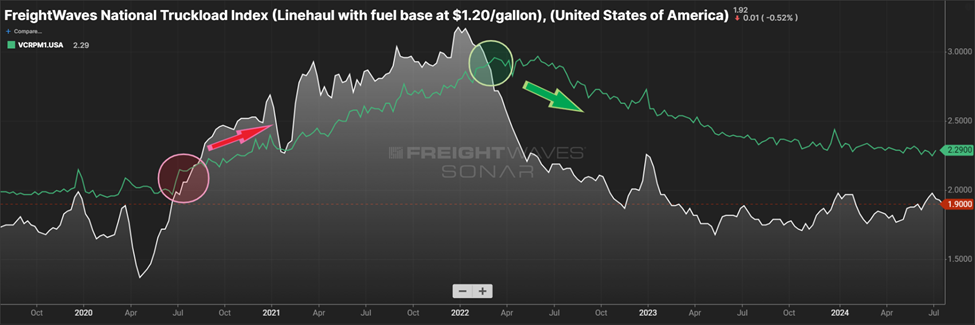
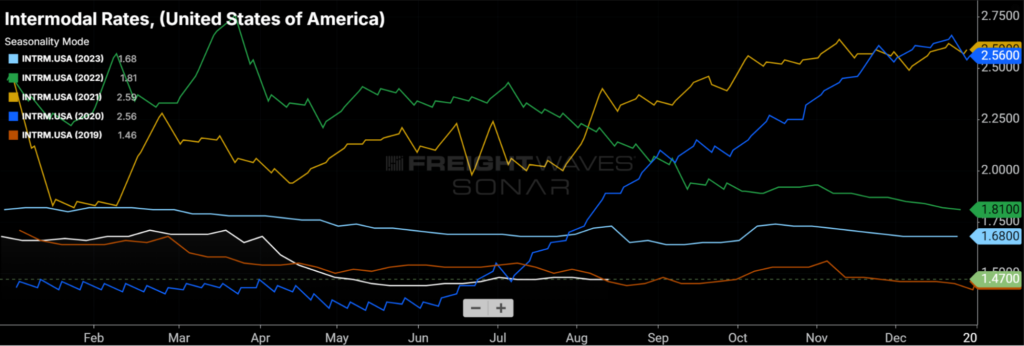
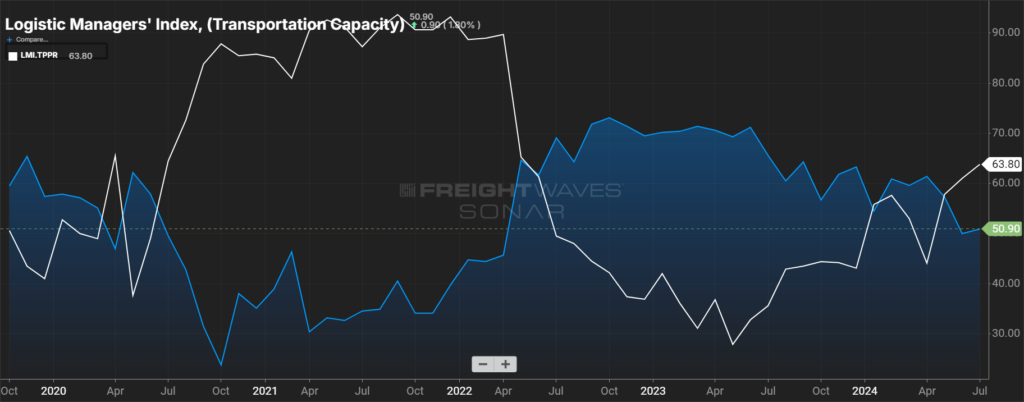
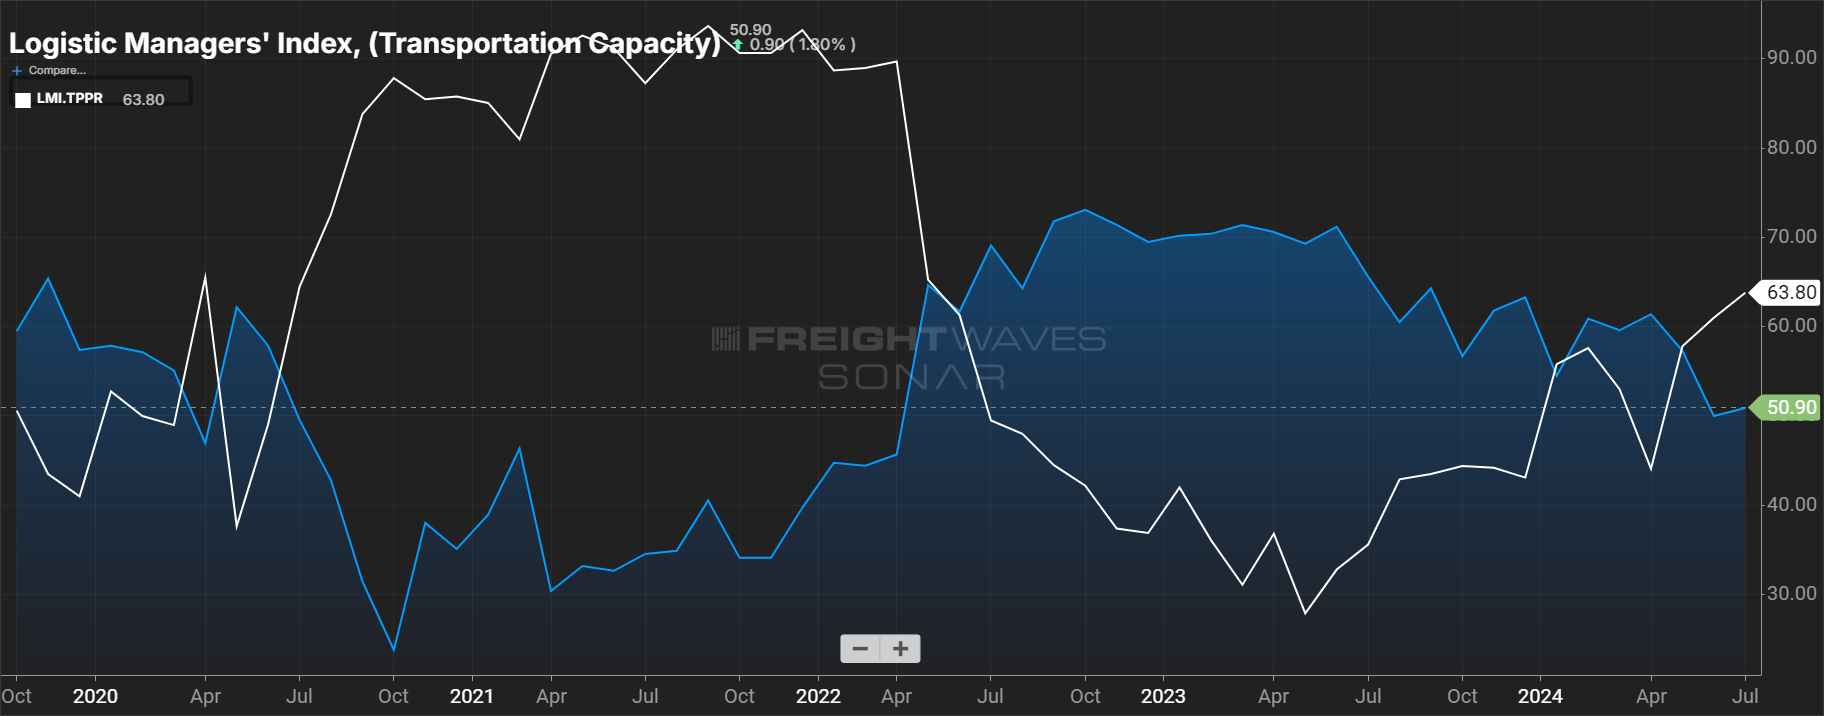
Transportation is a significant component of the LMI, with transportation capacity and transportation prices being two of the most closely watched metrics. Transportation capacity refers to the availability of carriers to move goods while transportation prices reflect the cost of utilizing these carriers.
In recent years, transportation capacity has been highly volatile, largely influenced by factors such as fuel costs and fluctuations in demand for goods. For instance, during periods of high demand, such as the holiday season or a surge in e-commerce activity, transportation capacity tends to tighten, leading to an increase in transportation prices. This tightening of capacity indicates that there are fewer trucks available relative to the volume of goods that need to be moved, which drives up the costs for shippers.
The transportation price index, meanwhile, provides a direct reflection of the cost pressures within the logistics industry. A rise in this index often correlates with tight capacity and increased demand while a drop might suggest a loosening of capacity, perhaps due to a slowdown in economic activity or an increase in the availability of trucks and drivers.
As seen in the chart above, transportation capacity and transportation prices are inversely related. When the two LMI indexes intersect, we often see a new transportation market cycle begin.
Warehousing Capacity and Prices
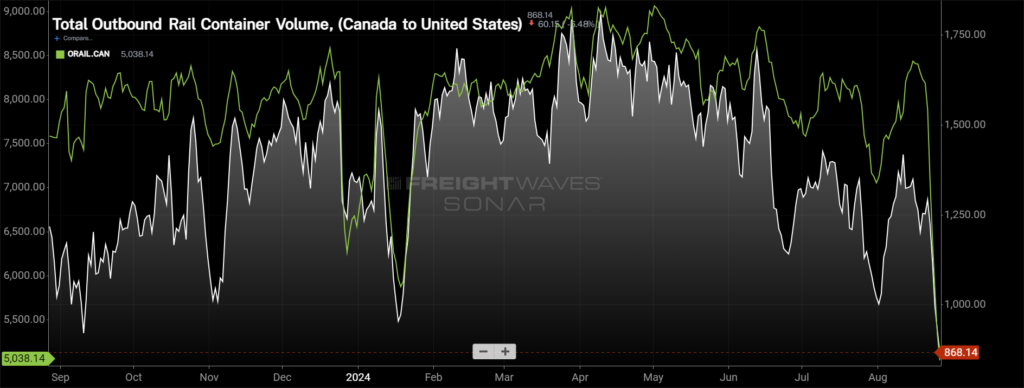
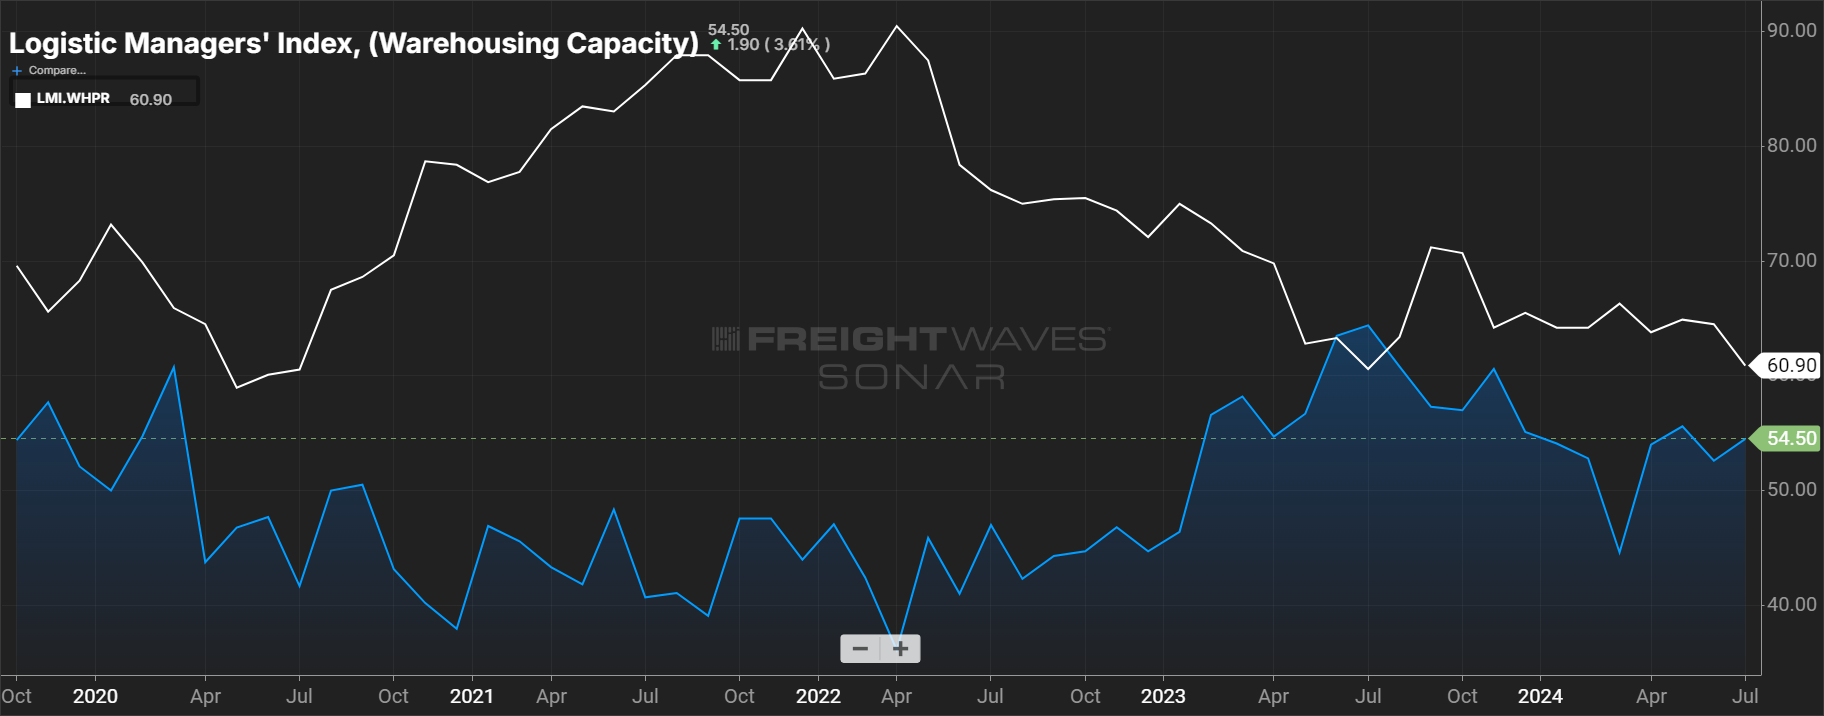
Another critical area of the LMI is warehousing, where the metrics of warehousing capacity and warehousing prices are key indicators of the sector’s health. Warehousing capacity measures the availability of storage space while warehousing prices track the cost of securing this space.
In the context of warehousing, capacity constraints have been a recurring theme. The e-commerce boom has led to a significant demand for warehousing space, particularly in urban areas near major consumer markets. As a result, warehousing capacity has often been strained, with the index frequently pointing to contraction. This is particularly true during peak periods, such as the holiday season, when the influx of inventory pushes storage facilities to their limits.
Warehousing prices, therefore, have seen a consistent upward trend, reflecting the high demand and limited supply of storage space. As businesses compete for available space, the cost of warehousing continues to rise, impacting the overall cost structure of logistics operations.
As seen in the chart above, warehousing capacity stays in contraction (under 50) more consistently than transportation capacity due to the secular trends of e-commerce. However, we can still identify the inverse relation between warehousing capacity and warehousing prices and mark the inflection points in the market when warehousing capacity and prices end one market cycle and begin another.
Conclusion
The LMI serves as an essential tool for logistics professionals, offering a clear picture of the sector’s current state and providing a forecast for future conditions. Transportation and warehousing metrics, in particular, are vital components of this index, as they directly impact the efficiency and cost-effectiveness of supply chain operations. By closely monitoring these metrics, businesses can better anticipate challenges and opportunities, allowing them to make informed decisions that optimize their logistics strategies. As the logistics industry continues to evolve, the LMI will remain a key resource for navigating the complexities of this dynamic field.
Submit a demo request to learn more about how you can utilize SONAR data at your organization!