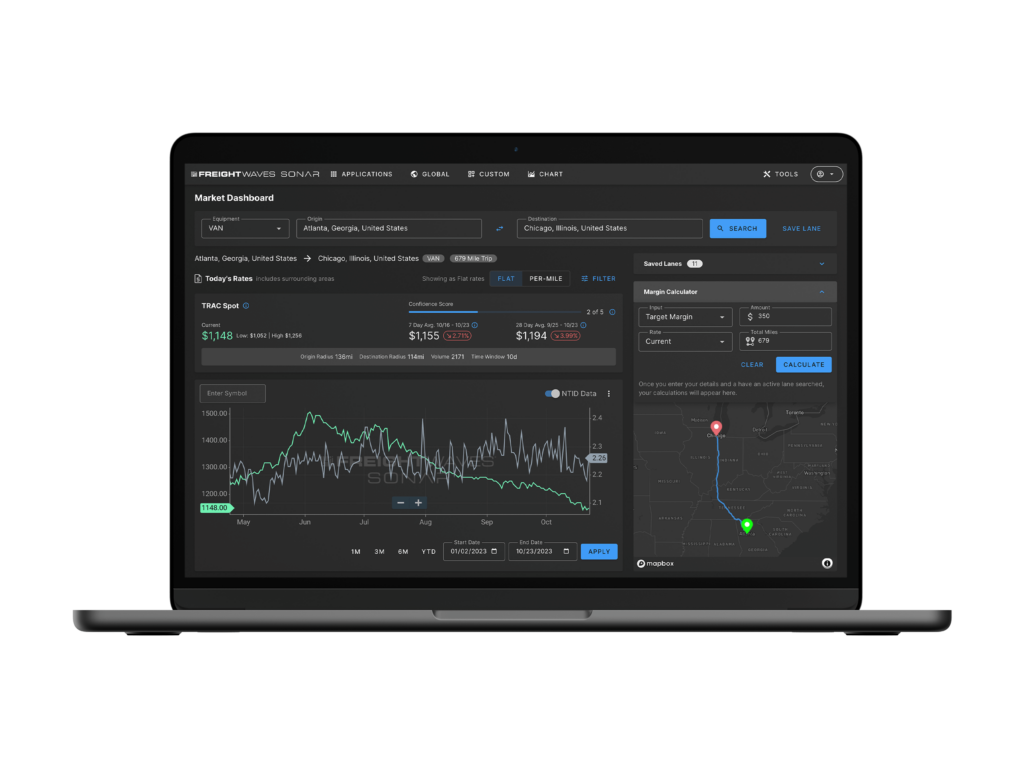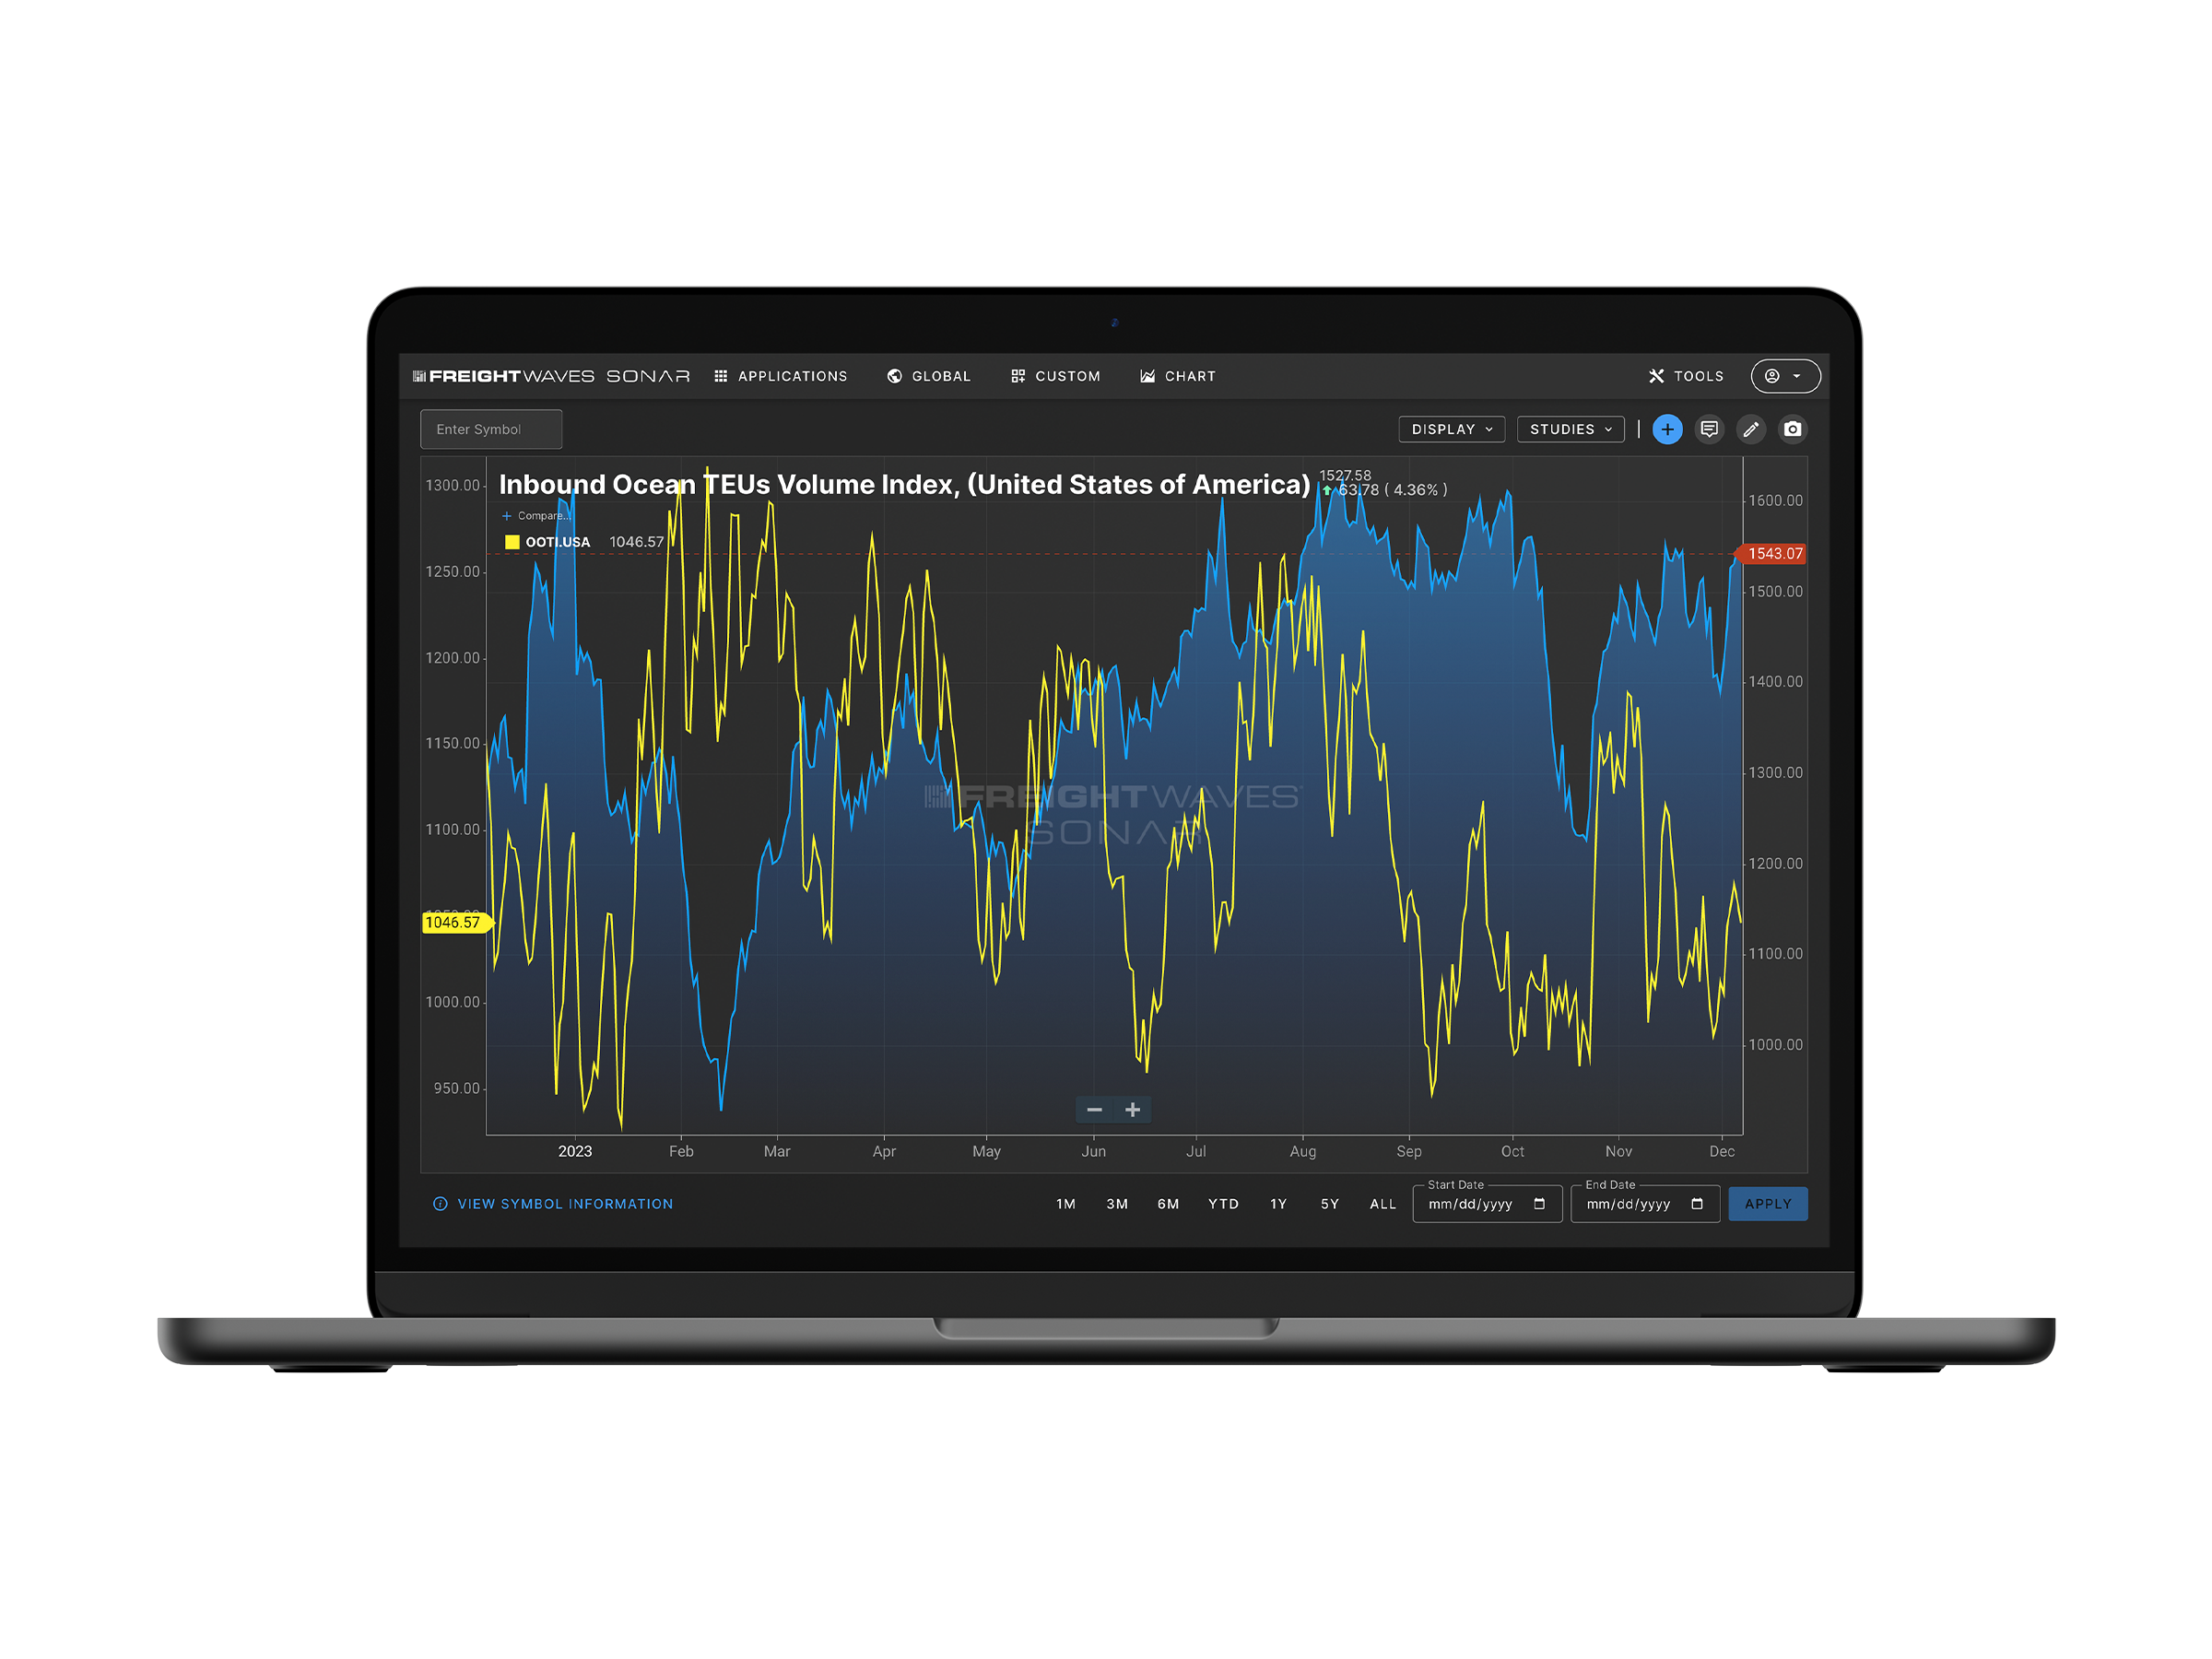
SONAR is the only data source that aggregates and provides daily national and global-level data on the freight and consumer goods market.
Use our calculator to find out.
By increasing the number of loaded miles per day your drivers drive by 1% and your rate per mile by $0.03 you will make more per week #WithSONAR.
#WithSONAR you can save up to per week through better bid negotiations and more effective management of your routing guide.
#WithSonar you can add 1 more load per person each day and increase $5 margin per load, earning your company an extra per week.
Disclaimer: Every company’s circumstances are unique. Fixed and variable expenses, market conditions and operational factors vary. Unforeseen events may also affect results. Calculated potential results reflect the consensus expectation of FreightWaves’ experts. Actual results may vary.
Unlike any other industry data provider, most FreightWaves SONAR data is gathered at the point of booking, making it high-frequency and far less prone to error or bias. This changes the game in proactive calls and trading for financial professionals.
Rather than relying on batches of lagging data from industry players, SONAR reduces lag time from one to seven days on 93% of all data. This provides finance professionals and hedge funds with the clearest view into granular insights into consumer behavior, goods flows in retail distribution networks and manufacturing activity, allowing you to make calls ahead of the market and add more money to your bottom line.
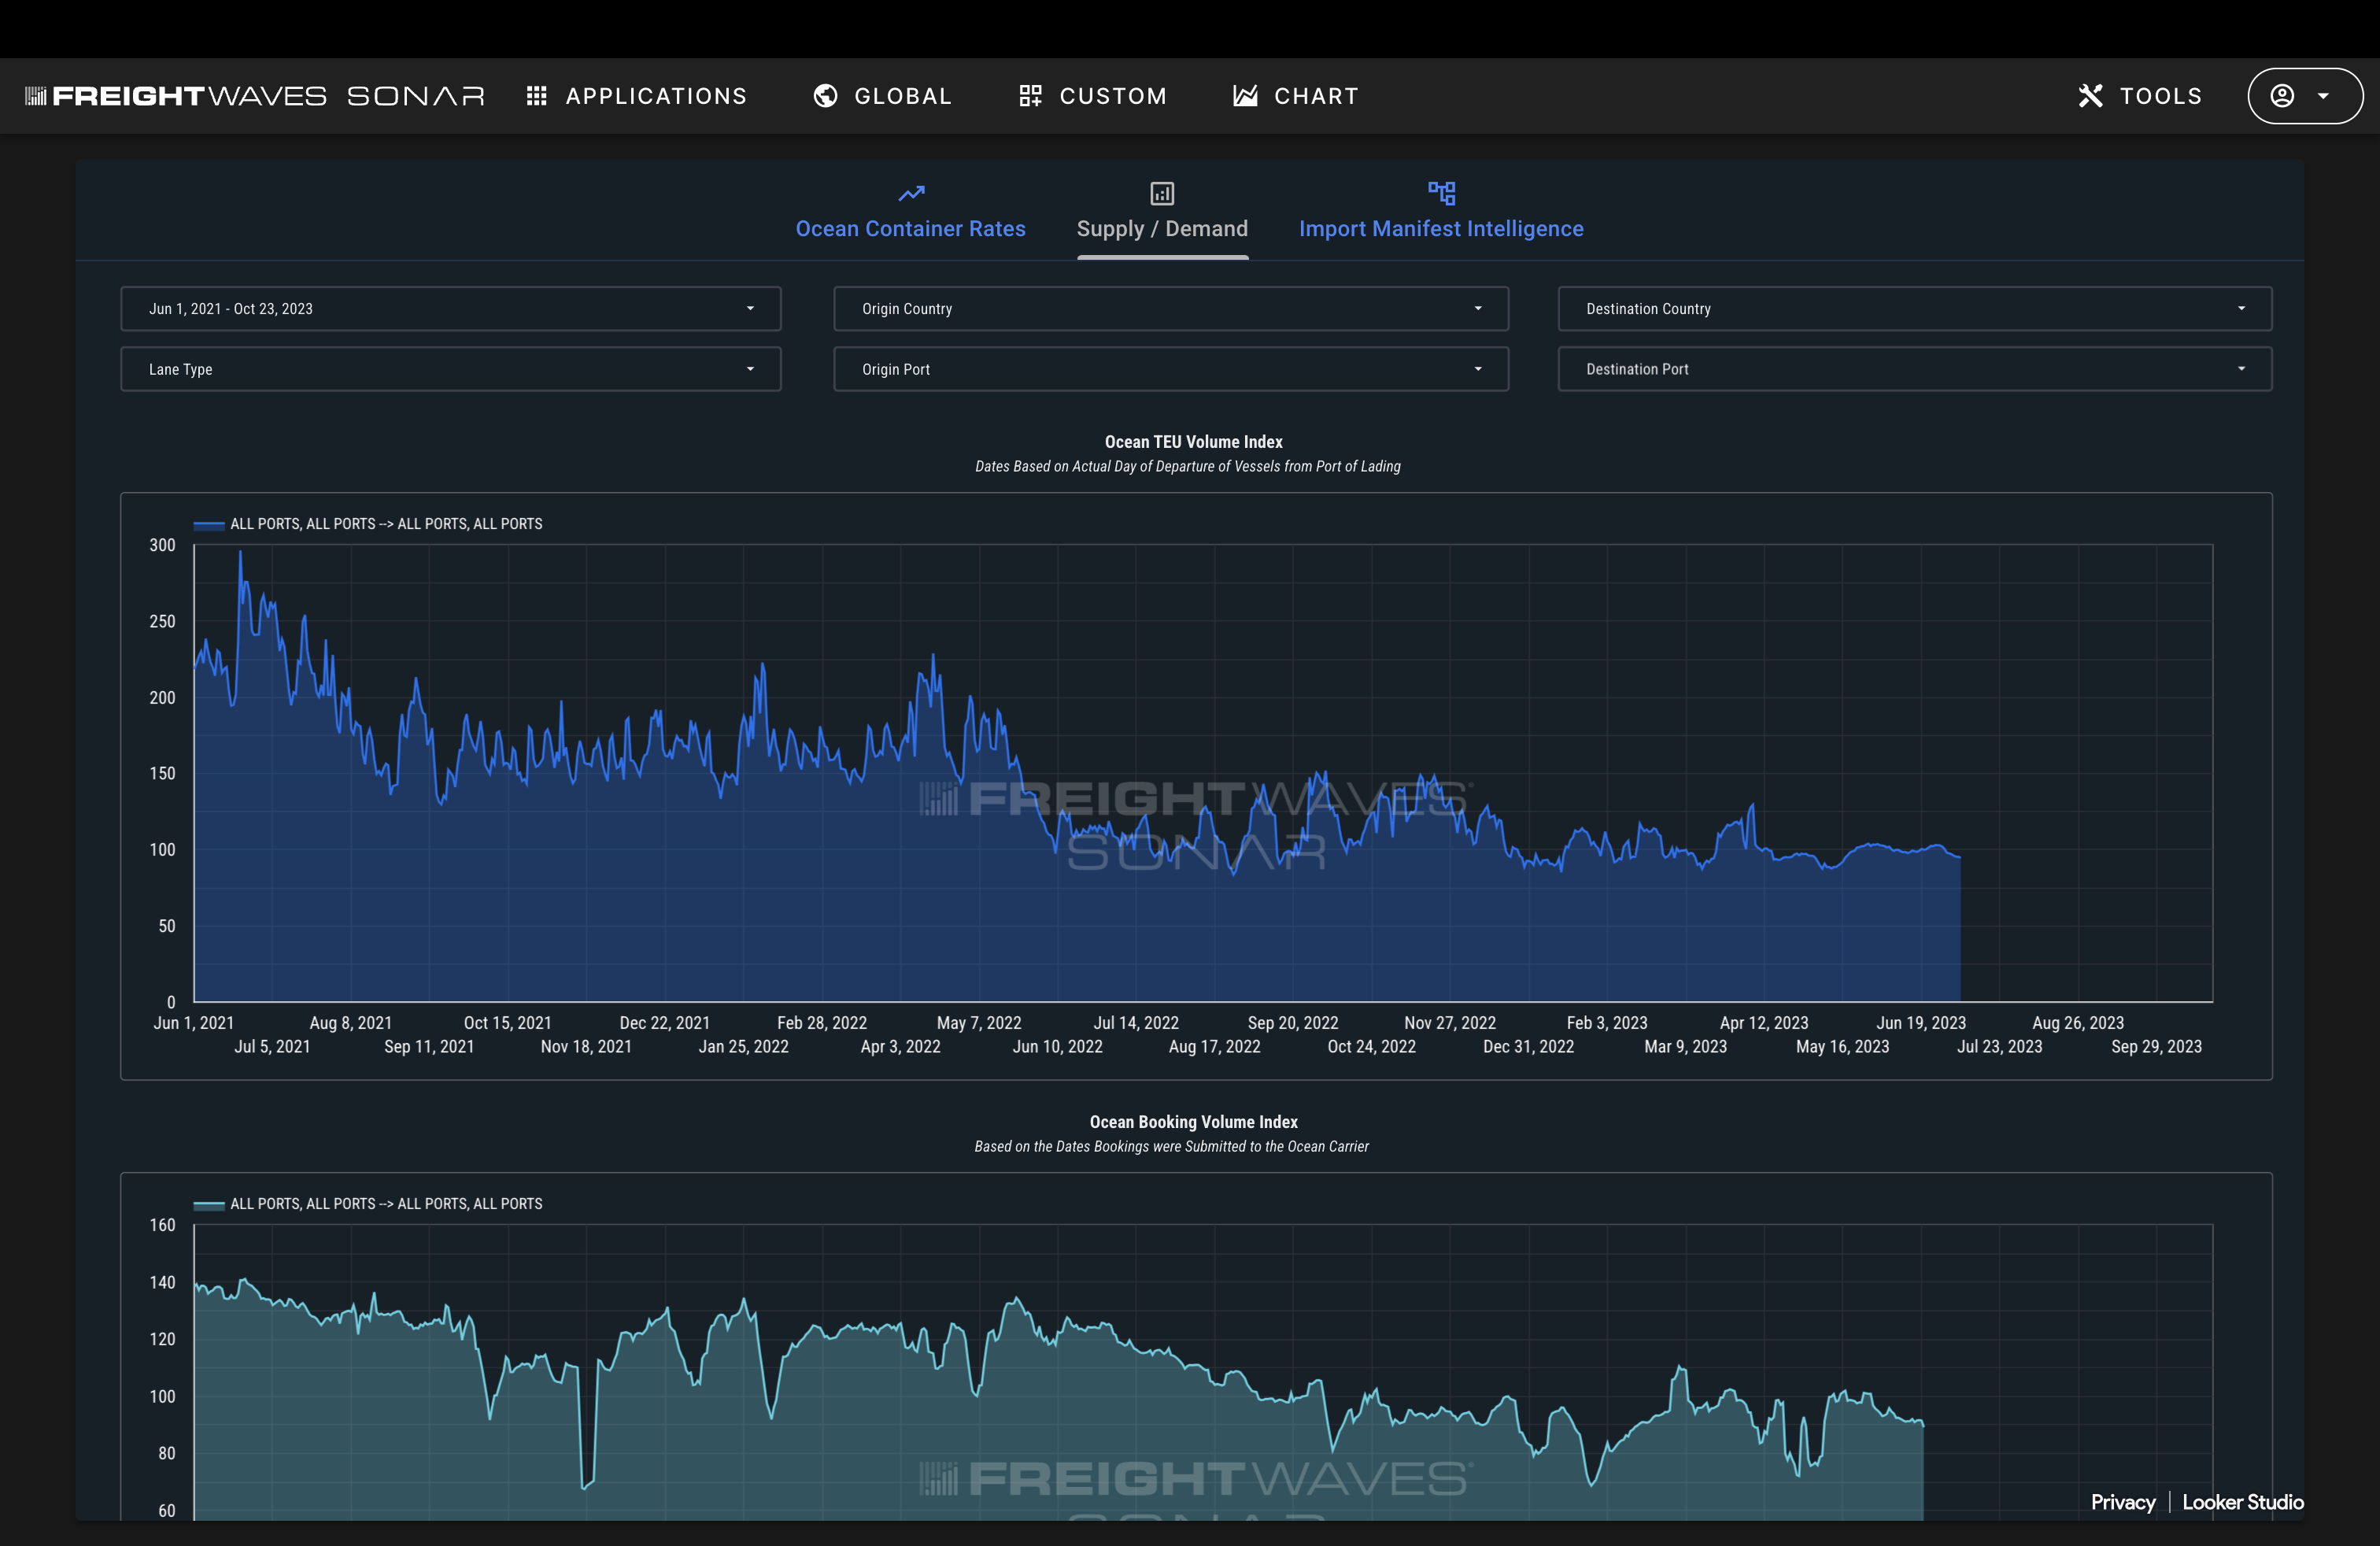
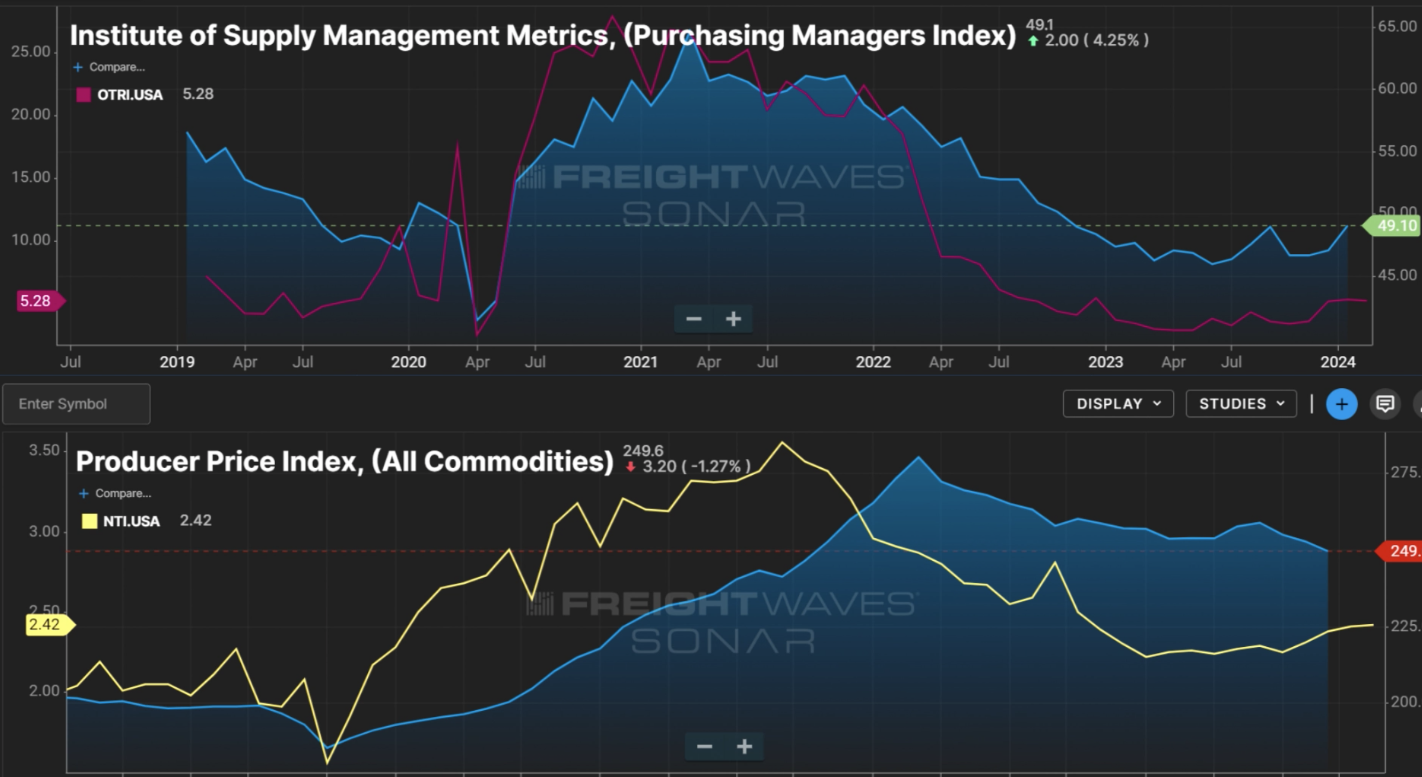
FreightWaves SONAR provides a multimodal view of freight market dynamics so that financial institutions and hedge funds can assess risk, forecast growth, make informed trades and gain insight into how retailers and manufacturers react to the macroeconomic environment.
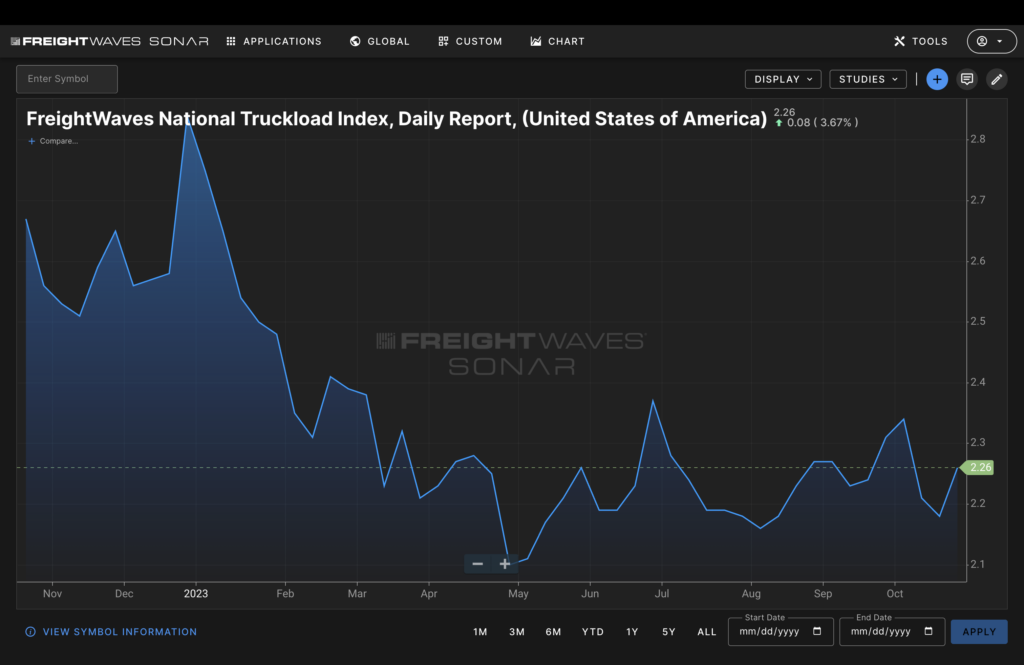
FreightWaves’ National Truckload Index (NTI) is a real-time proxy for the health of the national supply chain used by freight and non-freight businesses to make more accurate decisions. It provides real time visibility into changes in transportation cost, usually 3-6 months in advance of government data.
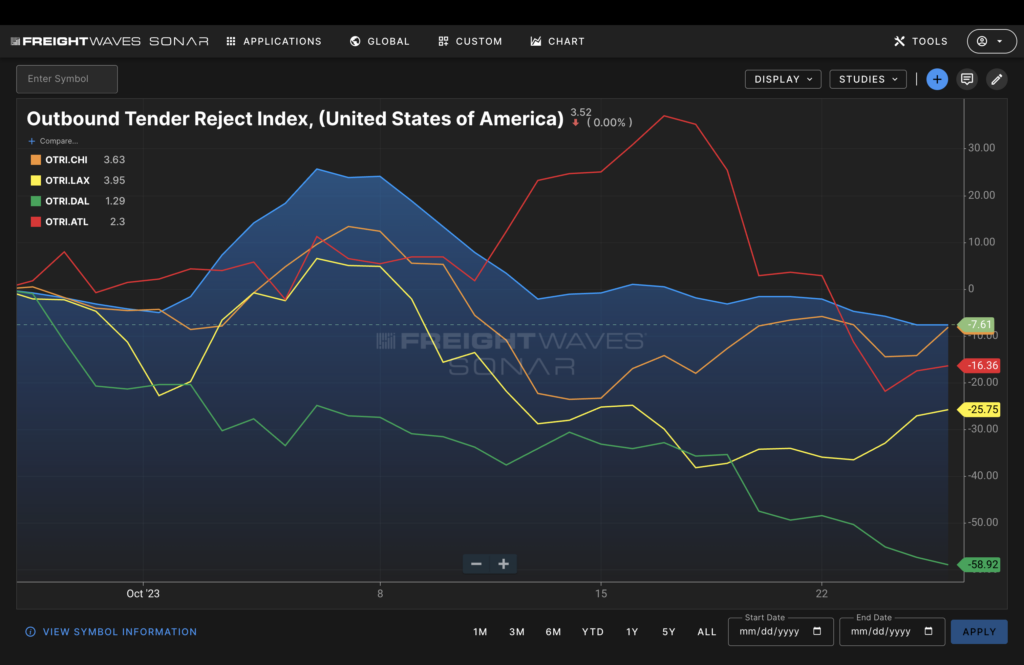
Manufacturing expenses and freight costs are inextricably linked. Financial professionals depend on SONAR data to indicate changes in capacity, which reflects supply and demand trends. Forecast pressures that clients face with certainty and provide a clear picture of what consumers may experience in the future.
