As a freight broker for truckload transportation, having an understanding of rate movements and your reaction time (or ability to be proactive in the market) to market changes directly impacts revenue and margin KPIs. Further, having an in-depth knowledge of the markets where your carrier base can operate at a lower rate or higher margin than other brokerages allows you to bid competitively, or to protect yourself if the market is outside of your normal wheelhouse. SONAR customers who contribute to the Trusted Rate Assessment Consortium (TRAC) have access to benchmarking data for their rates, along with market indicators that allow them to gain an understanding of their competitive advantages and opportunities in order to increase their margins and revenue.
Brokerages who contribute to TRAC have specific advantages over other brokerages in the truckload transportation industry. The TRAC Consortium comprises roughly 25% of the industry’s top 100 3PLs. TRAC contributors provide rates at the time of booking the truck for a particular load in order to drive transparency and accuracy for one of the most volatile data points in the market: spot rates. TRAC Contributors share these rates daily, providing the most near-real-time rate information that includes:
- 715,000 van lanes (and expanding)
- 450,000 reefer lanes (and expanding)
- Updated daily
- Statistical confidence scores
- 5/25 rule: no fewer than five contributors can return data on a lane, with no more than 25% influence on the pricing returned
TRAC contributors gain access to multiple benchmarking tools that provide insight into how their network compares to other brokerages, in addition to market-level insights. This is particularly valuable because as markets shift in terms of capacity conditions and rates, opportunities arise for brokerages who are prepared to make adjustments. These benchmarking tools include the MyTRAC rate in SONAR Market Dashboard, access to the TRAC Benchmarking App for granular analysis, and insights from SONAR’s market experts and customer success team in lane-level analysis.
MyTRAC in Market Dashboard
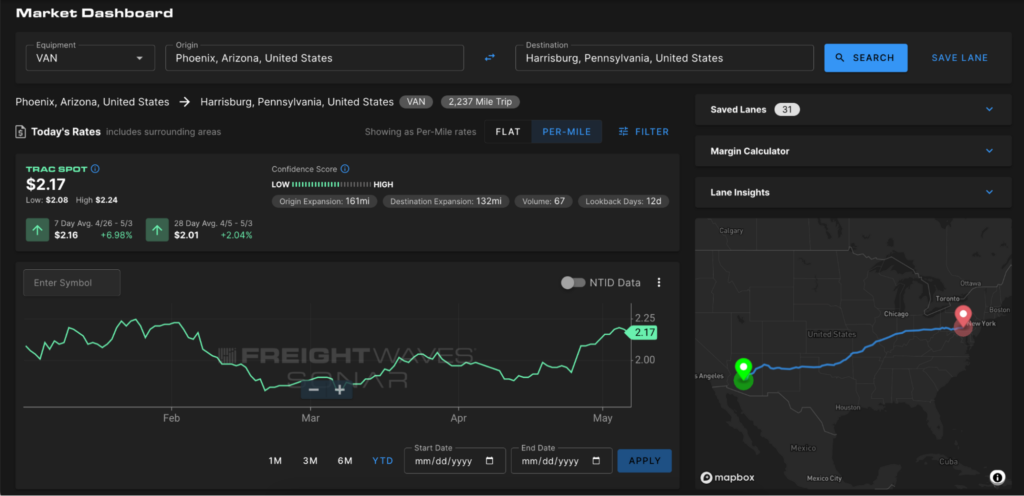
MyTRAC is displayed in the Market Dashboard UI for TRAC contributors to leverage market rates and their own data to create a customized suggested bid rate via machine learning. TRAC is known as the most up-to-date spot market rate in the market, with data coming from yesterday’s bookings by many of the largest brokers in the industry. Using the MyTRAC rate, users get a more prescriptive procurement target, which utilizes their existing purchasing behavior. This suggested rate eliminates the analytical step between seeing the market rate and blending it with their existing carrier base rates. With MyTRAC data, users can also identify lanes where they should be paying more or less and gain helpful context to plan ahead and optimize margins.
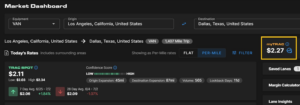
The MyTRAC rate displays on the right side of the user’s screen for easy comparisons to (and context for) the Lane Insights in Market Dashboard.
TRAC Contributor Benchmarking App
SONAR customers who are TRAC contributors also have access to the TRAC Contributor Benchmarking App. Brokerages who utilize this tool can compare their overall performance and lane-level performance against other members of the consortium to determine whether they are on pace, behind or better than market trends. Using the average percent rank data, brokerages can quickly see where they are paying more or less than the other contributors and by how much, depending on the point in time.
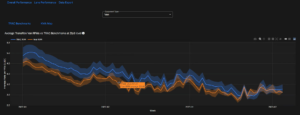
Overall Performance, TRAC Consortium rate-per-mile (RPM) trends vs. a TRAC contributor’s RPM
At the lane level, TRAC contributors can select specific lanes to analyze within the Lane Performance tab of the benchmarking app. At the lane level, users can quickly identify their rate-per-mile (RPM) delta and make adjustments as needed. This data is available for export as well for further analysis and easy distribution to the appropriate teams within their organization.
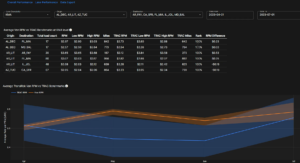
TRAC Benchmarking App at the lane level
TRAC Contributor Data Analysis
Best-in-class TRAC contributors utilize the benchmarking app and export their results to Excel or work with the SONAR market experts and customer success teams to determine their strengths and areas of opportunity. By combining market-level insights such as the Lane Score, TRAC Spot Rate Confidence Score and RPM deltas, SONAR customers can provide tactical lists to their internal teams in order to improve their margins and revenue. An example of this type of breakdown can be configured at a mileage-band level:
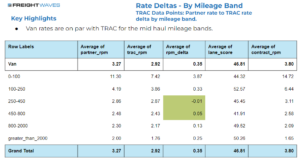
Example TRAC contributor analysis utilizing TRAC contributor data and lane scores.
SONAR customers who contribute to the Trusted Rate Assessment Consortium (TRAC) have access to benchmarking data for their rates, along with market indicators that allow them to gain an understanding of their competitive advantages and opportunities in order to increase their margin and revenue KPIs. If you are a current TRAC contributor and are interested in further analysis with a SONAR Market Expert, please email [email protected].
Not a current TRAC Contributor? Becoming one is easy, and the insights are incredibly valuable for your team. If you are a current SONAR customer, reach out to your Customer Success Manager or email [email protected]