Data sets across modes show evidence of risk mitigation
At this point, it’s unclear whether there will be a strike, as the International Longshoremen’s Association (ILA) is threatening, or whether a strike will be avoided, perhaps by the president invoking the Taft-Hartley Act ahead of the strike deadline. Even a short work stoppage would greatly disrupt freight networks. Sea-Intelligence estimates that for every one day of disruption from a potential strike, it would take five days to clear. And the avoidance of a strike altogether would not avert disruption if disgruntled workers stay on the job while purposely reducing productivity levels.
It would be highly impractical to divert some imported goods away from the East Coast ports, such as those coming from Europe. However, shippers moving freight from India or China to the U.S. often have some discretion over which ports they use.
The SONAR charts below show evidence of shippers looking to avoid getting caught in a potential ILA work stoppage.
Changing Maritime Shipping Patterns

The inbound ocean booking volume index for the Port of LA has outperformed the index for the U.S. as a whole. (Chart: SONAR)
The West Coast ports have taken share of import volume over the past several months for numerous reasons. In addition to the ILA issues, West Coast U.S. port volume has benefited from the Red Sea attacks, labor issues in Canada (both on the rails and at the ports), low water levels at the Panama Canal (although those have improved of late) and, possibly, a pull-forward related to the potential for incremental tariffs next year.
As it relates to mitigating the risk of an ILA strike, shippers can do that in a few different ways. One is to move the goods earlier – for instance, import holiday items in July and warehouse them. Another is to move goods on vessels bound for the West Coast instead of the East. Yet another is for shippers to diversify their ports of entry – after all, shifting containers to the West Coast could end up being a “crowded trade,” resulting in congestion.
Intermodal Volume Growth
Intermodal volume benefits from West Coast ports’ market share gains. That’s simply because the population is still most densely concentrated along the East Coast, and those routes are more compatible with the intermodal networks. The Intermodal Association of North America has estimated that around 70% of the import volume coming through the West Coast ports is moved via rail intermodal versus only about 20–25% of import volume coming through the East Coast ports.
SONAR allows users to view rail intermodal volume outbound from specific locations, broken down between international and domestic containers as well as between loaded and empty containers. In the third quarter, loaded international and domestic intermodal volumes outbound from LA are up 43% and 14% year over year, respectively. That is well ahead of the national year-over-year volume growth over the same time period for loaded international and domestic intermodal of 16% and 7%, respectively.
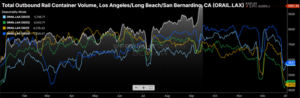
Outbound Southern California rail intermodal volume is up 27% year over year in Q3 of 2024 when all container sizes are included. (Chart: FreightWaves SONAR)
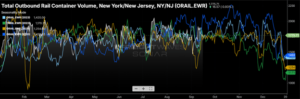
That same chart for outbound New York/New Jersey shows volume up just 1.1% year over year in Q3 of 2024. (Chart: FreightWaves SONAR)
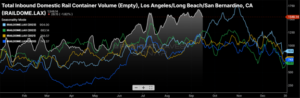
Empty domestic containers inbound to LA have grown to support additional demand in the region for transloading imports from international containers into domestic containers. (Chart: FreightWaves SONAR)
Import Volumes Impact Local Truck Markets
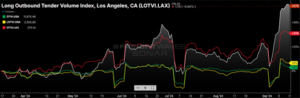
The long and overall Outbound Tender Volume Indexes for outbound LA have grown significantly faster than they have for the U.S. as a whole. (Chart: SONAR)
Imports are major sources of outbound freight for port cities, especially ones that would otherwise primarily be consumption centers. The Ports of Los Angeles and Long Beach represent the largest port complex in the U.S., representing about 30% of all containerized imports. A quick look at the relative tender volume indexes (a measure of truckload demand) for the region shows a sharp increase for outbound LA volume in general and long-haul outbound LA volume, in particular. The outperformance of the long-haul segment is an indicator that the volume is coming from the ports since imports that do not stay local typically have to reach distant consumption centers.
On its most recent analyst call in July, multimodal carrier J.B. Hunt said volume outbound from LA has not yet been commensurate with record-setting import volume at the West Coast ports – and it’s sure it isn’t losing share. One theory is that there has been greater growth in upstream inventories (located near ports or warehousing districts, such as the California Inland Empire) than in downstream inventories (located in or near densely populated urban areas). The implication is that there was a lot pent-up demand to move freight eastbound from the Inland Empire at that time. The latest readings of the LA Long Outbound Tender Volume Index suggest that freight started moving in higher volumes after Labor Day.
A measure of demand, the volume of long-haul (greater than 800 miles) tenders outbound from LA spiked in recent days. This data set, in addition to outbound LA rail intermodal volume, is one to watch as upstream inventory is moved downstream and could lead to periods of regional capacity tightness during the seasonally busy fall. (Chart: FreightWaves SONAR)
To learn more about how you can utilize SONAR data at your organization, reach out to our team to schedule a demo.