

Supply Chain Benchmarking for Beginners

You don’t have to use historical data to justify your contracts…or at least you shouldn’t. Transportation pros from the executive seat down to the entry-level analyst have better data to lean on to make their jobs easier. A common way for shippers to run RFPs, annual bids or even shorter projects is to simply rely […]
The Waterfall Theory of Freight

The waterfall theory of freight explains the factors behind how rates can fall out of contract and into the spot market. Learn how access to the best supply chain data on the market can help you manage costs at sonar.freightwaves.com.
How supply chain leaders can be the CFO’s hero

Cut costs, then help finance set new budgets Freight rates in all modes have come down hard since last year, and if you’re a transportation manager or supply chain leader, you probably feel confident about hitting your budget this year. You might be tempted to take the downcycle off, put strategic initiatives on the backburner […]
Predicting the next turn in the freight cycle
Freight markets feel stuck in unseasonable doldrums with volumes low, capacity loose and rates in a trough after supply chain activity cooled post-COVID. But as we know, the relationship of supply and demand is not static, but dynamic and ever-shifting. A pendulum moves slowest and briefly pauses just before it starts falling in the other […]
SONAR now has spot to contract rate spread
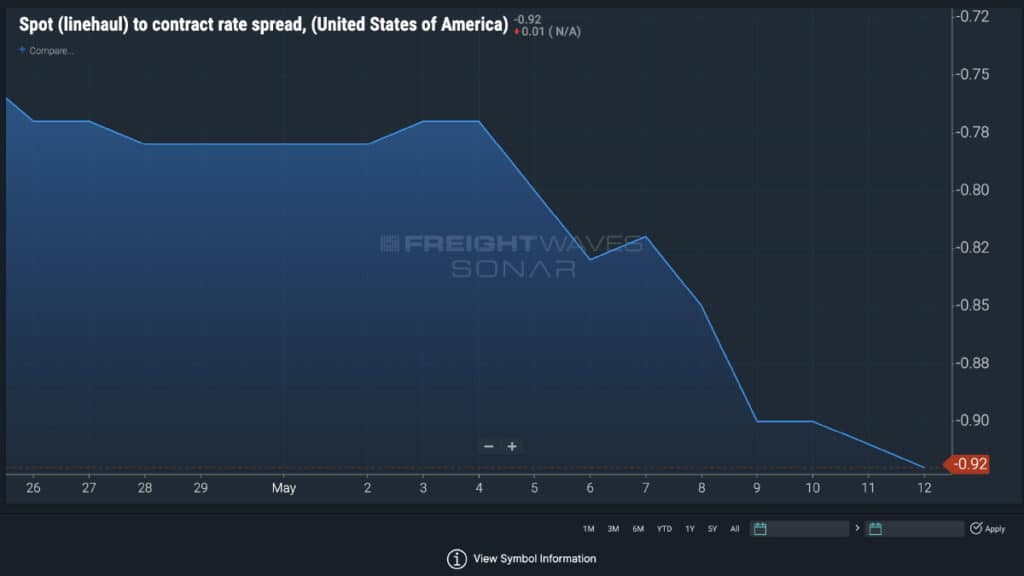
SONAR now contains a spot to contract rate spread index (RATES) to help users understand the short- and long-term relationships between transactional and long-term truckload pricing trends.
FreightWaves’ TRAC: Better Data Means Better Deals
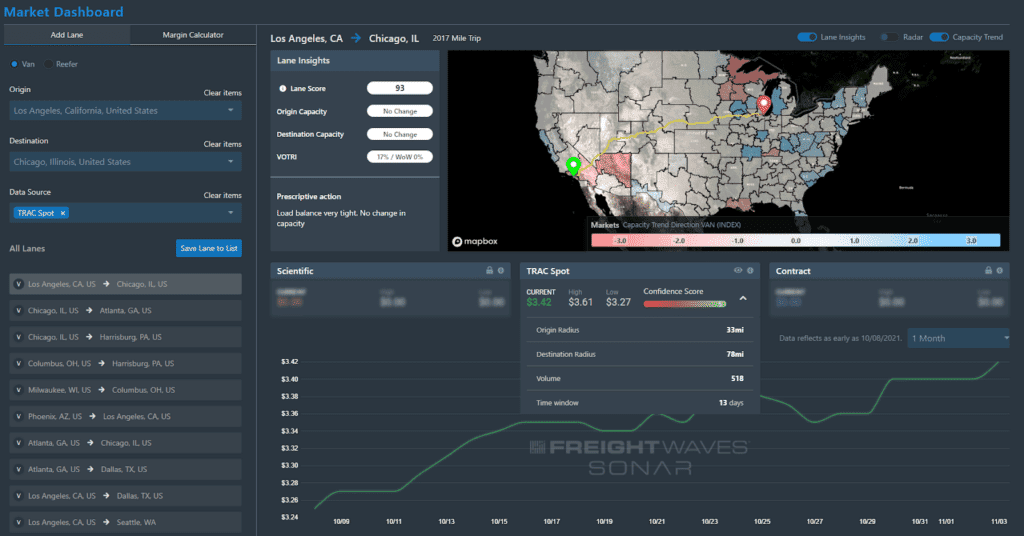
FreightWaves has formed the Trusted Rate Assessment Consortium (TRAC) to provide the most up-to-date view of U.S. spot rates.
Trucking rate relief in 2022? Not so fast

Shippers hoping for trucking rate relief in 2022 are going to be severely disappointed. The trucking freight market is one of the most volatile markets on the planet, especially since 2014. What is causing these massive swings? Supply and demand, naturally. If you really want to understand the market’s rate direction, you must understand how […]
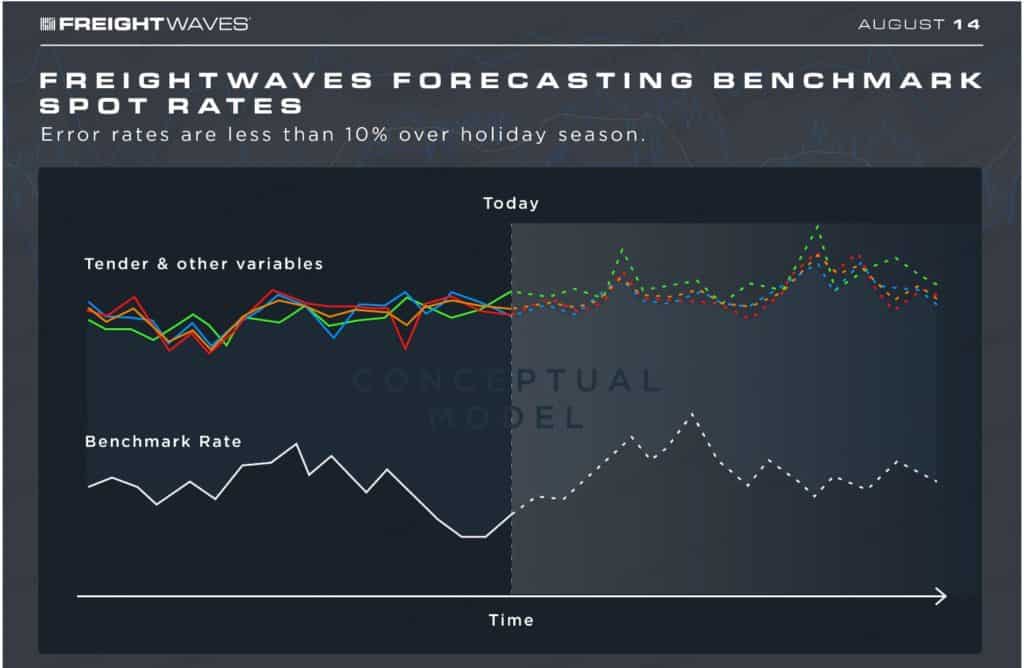
FreightWaves SONAR Forecasts of Benchmark Spot-Rates: Infographic
Request a Demo of SONAR today to start forecasting the rates on the spot market and keep your freight spend in check.
Forecasting benchmark spot rates

Overview FreightWaves Benchmark Spot Rates provide a cost-based model for setting spot rates for more than 735,000 zip3 origin-destination pairs greater than 250 miles in the contiguous United States. They are based on an empirically derived conceptual model that accounts for market conditions, including tender data, toll data, several other miscellaneous variables, and aggregated carrier […]
Spot or contract trucking rates? Neither – it’s the “market rate” you should be measuring

Trucking rates are subject to massive sways within the industry. Tariffs may arise. Storms may bring an immediate surge in demand for construction material supplies. The alternative forms of trucking – including construction – have an impact on the market. How? The answer rests with the drivers. Without drivers, the trucking rates that are stable […]
How to make more accurate trucking spot rate predictions

One of the most important tasks for freight forecasters is forecasting transportation rates, which are localized. That means that rates in Los Angeles are different from rates in Chicago or Dallas or any market large or small. The two primary types of transportation rates are contract rates and spot rates, which exist in each market. […]
What is the difference between spot rates and contract rates

When shippers are looking to move freight, they can pay one of two rates to do so: long-term contractual rates or short-term spot rates. Contract rates Contract rates make up 80% of the trucking market and make sense for both carriers and shippers when freight is consistent and travels on regular lanes. Contract rates are […]
How to use SONAR to monitor freight markets

Freight volumes SONAR’s outbound tender volume index (OTVI) measures electronically tendered truckload volumes across the U.S. Overall OTVI is indexed to 10,000 (March 1, 2018) and is the aggregated volume in 135 U.S. freight markets. OTVI is the most accurate near-time view of the full truckload markets. Freight forecasters use the OTVI index to monitor […]
How do tender reject rates predict the freight economy?

Tender rejections occur when a contracted carrier rejects an electronic load request from a shipper customer. FreightWaves SONAR measures the former via the outbound tender reject index (OTRI). Carriers really only have two reasons for rejecting a contracted load. One, they do not have available capacity to service the request. Or, two, there are more […]
Freight economy rebound may be underway. Carrier bankruptcies and unseated trucks will drive next spot rate surge.

Freight volumes are slowly come back to trucking market, but it will take a while before volumes in the contract freight market are significant enough to drive higher spot rates. There is a potential capacity shortage by the end of the year, caused by unseated trucks and trucking bankruptcies.
How are spot rates calculated?

Transportation rate analysis is a core part of any seasoned freight forecaster’s role. While the trucking contract market represents 85% of the freight volume in the for-hire truckload industry and the trucking spot market represents just 15% of truckload demand, the most volatile rates in the truckload industry can be found in the spot market. […]
Good news: The freight market is about to turn up

Freight market forecasting is a tricky game these days. Historical freight market data models provide good reference points, but because of the unprecedented nature of COVID-19 (a classic example of a black swan event), we have to rely on current data to understand what is taking place in the freight market. The good news is […]
Top things a trucking company can do to maximize trucking rates

Regardless of whether a trucking is primarily a dry van truckload carrier, reefer, or flatbed, all carriers have one thing in common – a desire to maximize trucking rates.
Why historical spot rates alone are not the best predictor of future spot rates

History tends to repeat itself, or does it? A common thought in the trucking industry is that looking at historical spot rates are good indicators of what to expect each year. It is true to an extent that historical trends do well to predict certain aspects of future spot rates, such as seasonal movement, but […]
Why do trucking spot rates change daily?

Trucking spot rates are the matching of real-time demand with real-time capacity on a daily basis.


