Maximize Trucking Rates with High-Frequency Data for Freight Carriers

Move truckloads at competitive rates to out-earn your competitors.

Challenges Facing Freight Carriers

  • Unpredictable volume dynamics hinder asset utilization
  • Existing carrier rate data is on a significant lag
  • No insight into market-wide capacity trends
  • Inability to bring volume, capacity, and rate data together
  • Difficulty identifying favorable markets in time to deploy assets

What's the SONAR ROI?

Use our calculator to find out.

By increasing the number of loaded miles per day your drivers drive by 1% and your rate per mile by $0.03 you will make more per week #WithSONAR.

#WithSONAR you can save up to per week through better bid negotiations and more effective management of your routing guide.

#WithSonar you can add 1 more load per person each day and increase $5 margin per load, earning your company an extra per week.

Disclaimer: Every company’s circumstances are unique. Fixed and variable expenses, market conditions and operational factors vary. Unforeseen events may also affect results. Calculated potential results reflect the consensus expectation of FreightWaves’ experts. Actual results may vary.

SONAR Freight Market Intelligence for Carriers

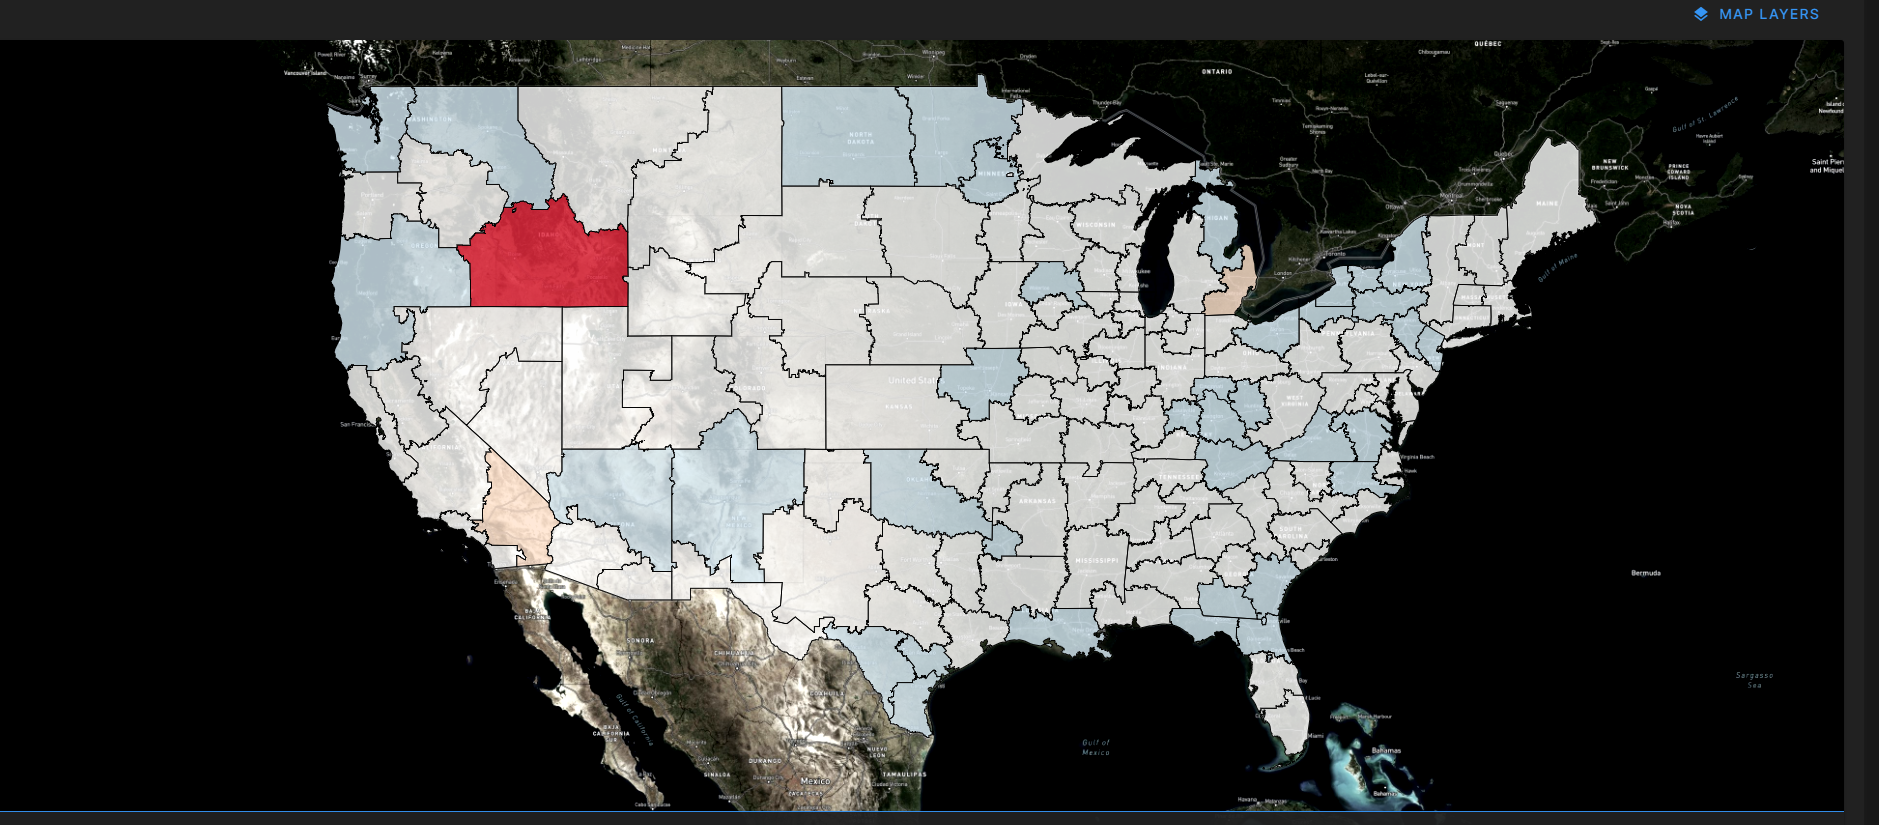
Carriers use FreightWaves SONAR to make data-driven decisions: evaluating load offers, deploying assets, and bidding on freight. With SONAR there’s no more relying on the gut, guess, and check method. SONAR’s best-in-class data analytics help carriers maximize revenue, minimize operating costs, and predict rates and capacity. Don’t rely on old, stale data in the increasingly volatile trucking market. Level-up your business with the freshest market insights. Take advantage of vast datasets to improve your bottom line. Utilize SONAR’s Headhaul Score to strategically position trucks and avoid regions that are saturated with capacity.

Minimize Costs with Operational Benchmarking

SONAR truckload datasets include contract and spot truckload rates as well as volume and capacity trends. But SONAR also allows carriers to benchmark financial metrics like empty miles, fuel spend, and insurance costs against the peer carriers.

  • Find the lanes with the best revenue opportunities
  • Increase truck and asset utilization in the ever-changing freight market
  • Benchmark financial metrics against peer carriers anonymously
image of a SONAR OTVI map

Measure Market Dynamics and Make Data-Driven Decisions

The SONAR data intelligence platform equips carriers with actionable insights to make data-informed decisions – despite market fluctuations.

  • Access wholesale fuel and rack price data to make better fuel-buying decisions
  • Use outbound tender data to focus sales efforts in freight-dense areas
  • Utilize the Power Pricing Index to know carrier negotiating power in freight rate discussions with shippers

Spot Capacity Trends and Maximize Margins

Access SONAR’s Outbound Tender Volume, Outbound Tender Rejection, and Inbound Tender Volume indices to understand the market on a national, regional, or local scale.

Outbound Tender Volume Index (OTVI)

Displays where freight is available

Outbound Tender Rejection Index (OTRI)

Identifies market tightness or looseness

Inbound Tender Volume Index (ITVI)

Tracks capacity availability

a screenshot of a SONAR dashboard

Want to know how you can use SONAR SCI to avoid losses, increase customer satisfaction, and improve workflows?

Request a demo to talk to an expert.
White Papers
February 6, 2024

Asleep at the Wheel: Shippers and the Freight Market Outlook for 2024

November 1, 2023

Index-Linked Contracts: A New Solution for Shippers’ Dissatisfaction with RFPs

August 3, 2023

Catering to the winners – SONAR subscribers beat the market