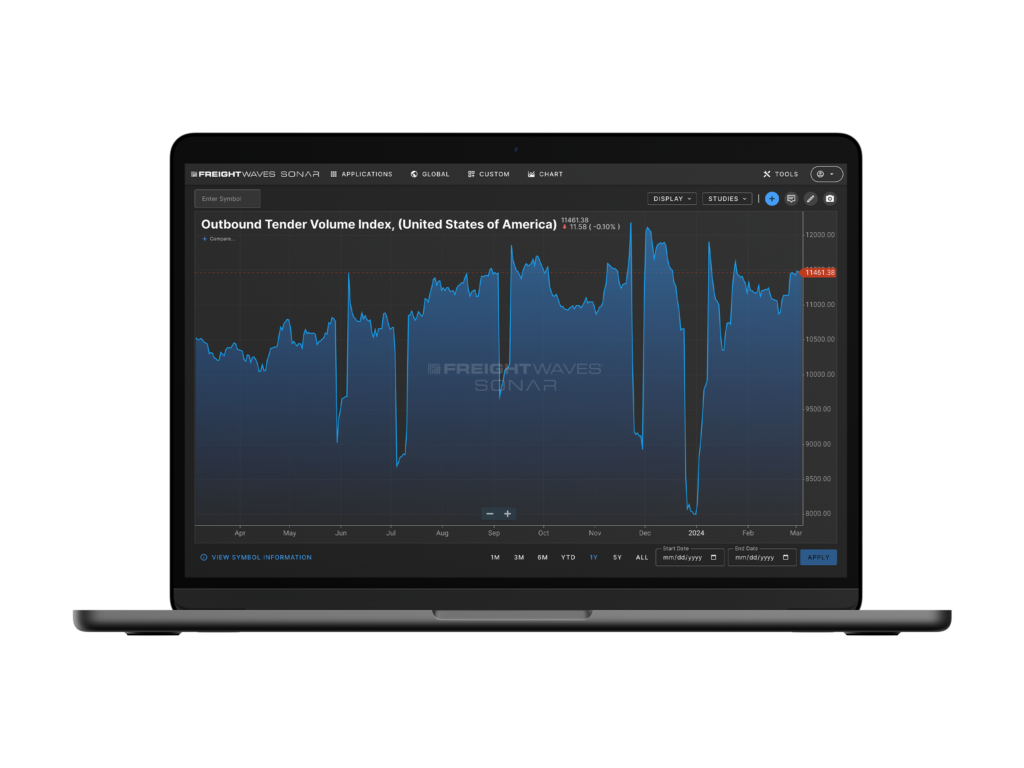
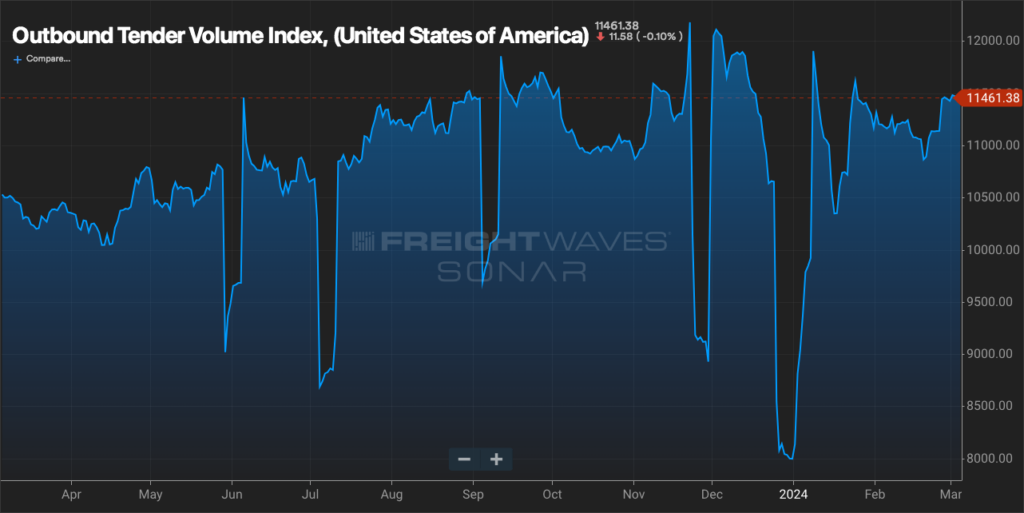
FreightWaves SONAR Outbound Tender Volume Index (OTVI)
FreightWaves SONAR Outbound Tender Volume Index (OTVI) is a measurement of electronic offers from shippers to truckload carriers for the transport of goods. OTVI is an indicator of raw demand for trucking capacity. Truckload freight volume is a barometer for business activity around physical goods required by businesses and consumers.
Uniquely important, tender data is a leading indicator of raw demand. In SONAR, tender data shows future freight movement. Compared to freight payment data, which is reported after freight is delivered, tender data is a more up-to-date and reliable indicator of market demand.
Shippers, freight brokers, fleet managers, transportation executives, owner-operators, economists, financial analysts, investors and bankers rely on this data. OTVI allows supply chain teams to visualize freight movement patterns and volatility and is a leading indicator of price movements.
OTVI allows shippers to monitor outbound volumes in the markets where they operate. Shifts in freight volumes tend to cause changes in capacity. This applies upward or downward pressure to carrier rates.
Carrier rates vary based on a destination. SONAR’s length of haul indices allow brokers to analyze destination markets by lane. OTVI helps brokers identify shifts in demand in order to better optimize margins.
OTVI allows carriers to view the demand for capacity in a market. Carriers rely on this data to position fleets in opportune areas.
See inbound/outbound freight movement using OTVI
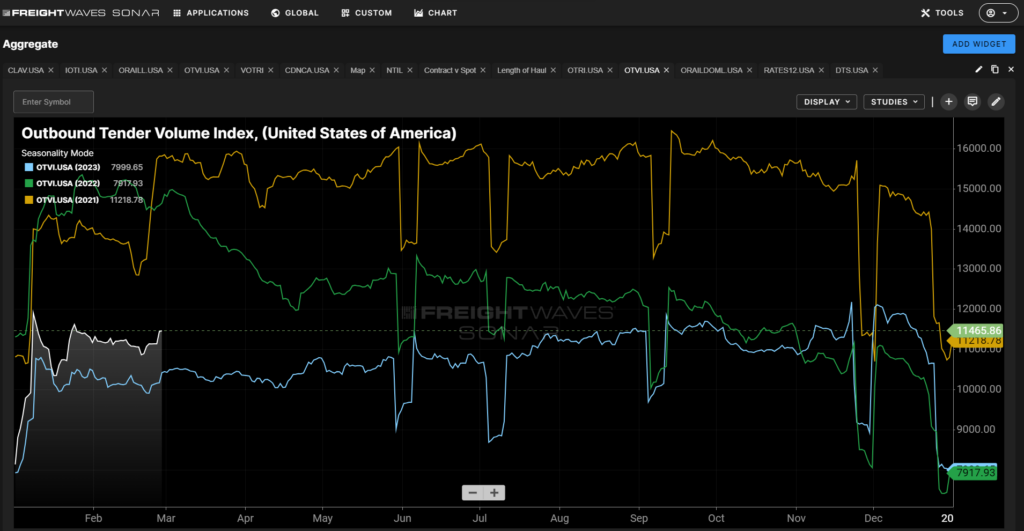
FreightWaves SONAR’S Outbound Tender Volume Index helps users identify freight volumes that are shipping at national, regional or market granularity. OTVI allows users to see where demand for trucks is increasing or decreasing.
An increase in freight volumes denotes tightening capacity.
A decrease in freight volumes denotes loosening capacity.
Fluctuations in OTVI correspond to rates paid by shippers to carriers. An increase in freight volumes tends to increase carrier rates. A decline in freight volumes tends to decrease carrier rates. Users view OTVI data on a U.S. map, tree map or chart.
This index symbolizes a strong correlation with macroeconomic factors like goods spending and retail sales.