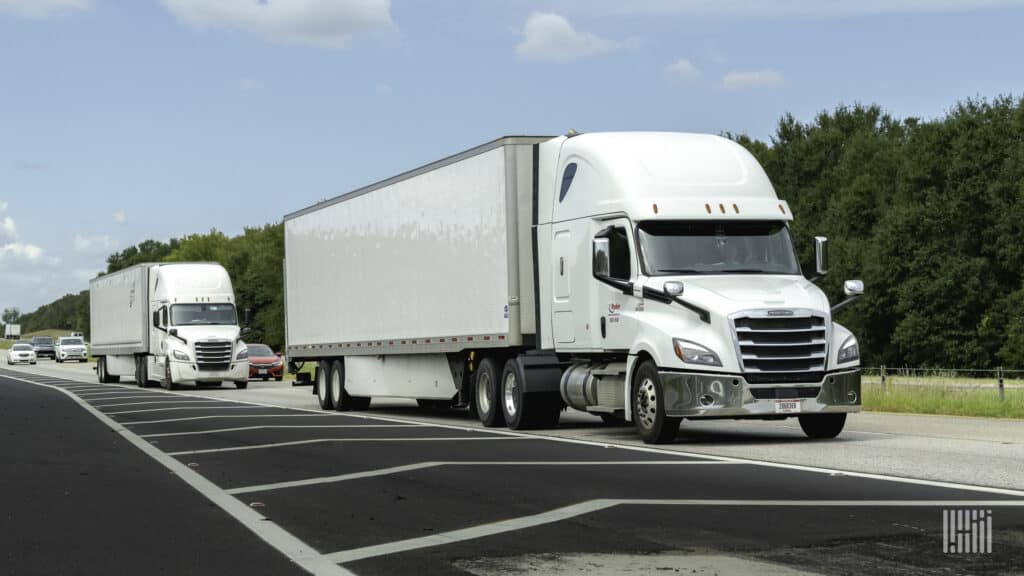
Freight forecasters need to understand what drives the freight economy in order to forecast volumes, capacity and rates.
Much like the general economy, the variables that drive the freight economy are too numerous to count. However, we can narrow down the principal factors to a select few that really move the needle. Many of these are common sense but bear further introspection.
Economic demand – Truck demand at the highest level is impacted by the overall economy. Gross Domestic Product (GDP) growth, industrial production, retail spending and consumption, inventory restocking, housing starts, agricultural demand (e.g. produce seasons), auto production and the weather are all important factors that drive the demand for transportation.
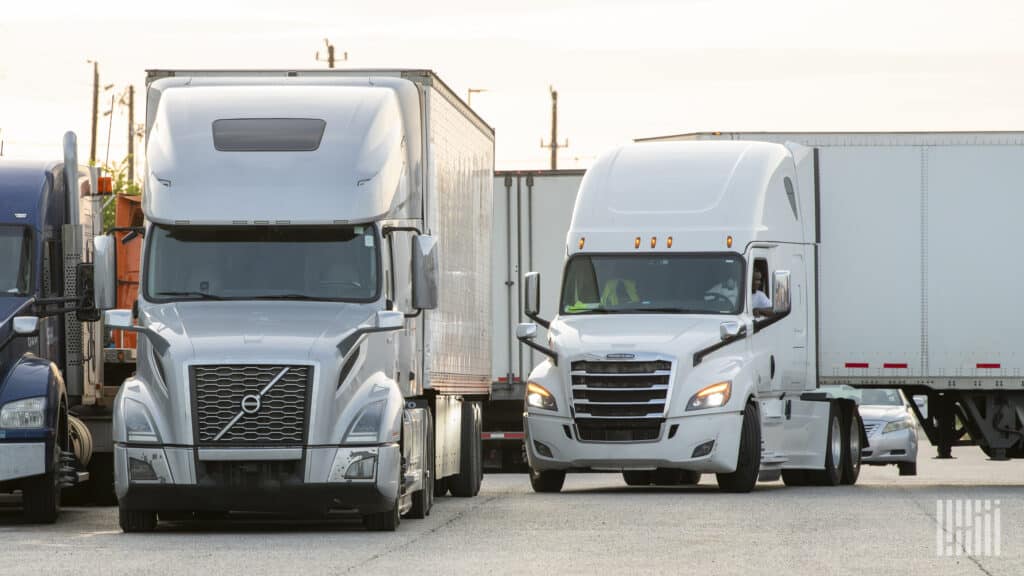
Truck capacity – On the supply side, capacity (or the number of trucks and drivers in the market relative to the demand for the aforementioned) is the critical factor. Total drivers available for dispatch is largely considered the most important variable in determining trucking market capacity.
Trucking rates – Contract and spot rates are determined by the intersection of supply and demand, with the directional movement determined by which party has more negotiating power – carriers or shippers.
Gross Domestic Product (GDP) – Going back to the highest level macroeconomic demand factors, the equation for real GDP can be decomposed into consumption (69% of U.S. GDP) + business investment (18%) + government spending (17%) + net exports (-4%). Consumption, business investment (e.g. capital spending and inventories) and net exports all impact transportation, with less impact from government spending, which is primarily spent on defense.
Consumer spending drives the U.S. economy, accounting for almost 70% of GDP. However, of that 70%, two-thirds is derived from services (e.g. banking, education, healthcare) while just one-third is from goods.
This means the make-up of the freight economy is less heavily weighted to consumer spending than the overall U.S. economy because service-oriented consumer businesses are not responsible for moving much freight. Conversely, due to the nature of physical goods, the freight economy is weighted to the industrial, energy and agriculture sectors relative to the overall U.S. economy.
Durable and non-durable goods – The freight markets are weighted to the one-third of consumer spending in the U.S. dedicated to goods (both durable and non-durable), restaurant spending, groceries and consumer packaged goods (CPG). Durable goods are things like autos, furniture and large appliances, while non-durable goods are things like clothing, food and fuel.
By that measure, whether spending on physical goods for consumption in the U.S. is increasing or decreasing is an important factor that drives freight volumes and rates. At FreightWaves, we estimate that about 25% of trucking volume in the U.S. is from non-food retail and if one includes food retail, that figure grows to closer to 35% to 40%. Consumer spending is clearly a major factor in the freight economy (and particularly for the dry van sector).
Inventories are also a meaningful factor in the freight economy because inventories must progress from raw materials to goods-in-process to finished goods before they are ultimately sold at the wholesale or retail levels. Freight shipments happen all along the inventory production supply chain. The inventory-to-sales ratio is a particularly useful metric in transportation; typically it will rise when businesses are more optimistic about future demand, but this is not always the case (for example, when there is a rapid downward inflection in demand, which is happening now because of the pandemic).
Industrial production is the combined output of industries like manufacturing, metals, mining and construction. All of these heavy industries require a l substantial number of freight shipments and therefore are big factors in terms of driving the freight economy. The amount of freight moving through the transportation system is historically closely correlated with the annualized percentage growth in industrial demand and production.
Construction – Within construction, there is commercial and residential construction. Both are important factors to measure in the freight economy. Key metrics in residential construction include housing starts, new home sales, existing home sales and renovations. When each of these activities is increasing in volume and frequency, so will the demand for related freight (e.g. lumber, roofing materials, paint, etc.).
Energy (oil & gas drilling and production) is an important factor in the freight economy, with much of the volume by trailer type in this industry heavily weighted to flatbed. Clearly, with oil prices hovering below $15 per barrel (and down about 80% year-over-year as of May 2020), this will continue to be a very depressed industry, and therefore for related trucking demand, for at least a couple of quarters.
Agricultural and farming – Regarding agriculture as a factor in the freight economy, total farm output in the U.S. is about $150 billion according to the U.S. Department of Agriculture (USDA), which amounts to less than 1% of total U.S. GDP ($21.5 trillion). However, 100% of that output moves by truck at some point in its journey from farm to table and given much of it is perishable, a significant amount is spent on transportation. Further, much of the produce in the U.S. is grown in places like California, Florida and Mexico and must be hauled long distances to East Coast population centers where much of it is consumed (and 35% of our country’s population resides).
Critical events – Finally, exogenous forces like port strikes, hurricanes and other severe weather events are important factors in the freight economy but are much harder to forecast and their impact is generally sharp but fleeting.
The overall profitability of the freight economy will be significantly determined by the intersection of volumes and capacity (i.e. supply and demand) in the form of rates. When the economy is running hot and freight volumes tied to consumer spending, industrial manufacturing, construction, agriculture and energy are all moving up in kind, if capacity is tight then rates should soar in the spot market and experience gradual upward pressure in the contract market. The former situation leads to significant expansion in the overall freight economy, which is about $800 billion in the U.S. today (about half for-hire and half private fleets).
Truck capacity is a critical factor in the freight economy because loose capacity and weak pricing is typically driven by over-ordering of trucks at the top of the freight cycle. The reverse is usually true during (and shortly after) freight recessions as the industry cleanses itself of excess capacity through bankruptcies, voluntary movement of truck drivers to other industries and depressed new Class 8 truck orders (running below replacement demand and exacerbated by a flooded used market).
In general, barriers to entry in the trucking industry are very low because all a driver really needs is a commercial driver’s license and an insured truck to enter the market. This dynamic makes each of the above factors important enough to monitor on a continuous basis due to the trucking industry’s high underlying sensitivity to each.
If you are interested in tracking the freight market, including contract and spot rates, FreightWaves SONAR offers over 150,000 indices, most of which are updated daily. The world’s fastest, most accurate freight data includes trucking spot rate indices, tender indices, and market balance indices. SONAR freight tender indices are created based on actual electronic load requests from shippers to carriers, meaning you know that the index is measuring an actual load transaction.
SONAR offers proprietary data that comes from actual load tenders, electronic logging devices and transportation management systems, along with dozens of third-party global freight and logistics-related index providers like TCA Benchmarking, Freightos, ACT, Drewry and DTN.
SONAR offers the fastest freight market data in the world, across all major modes of traffic. The SONAR platform is the only freight forecasting and analytics platform that offers real-time freight market intelligence driven off actual freight contract tenders. To find out more about FreightWaves SONAR, sign up for a demo.