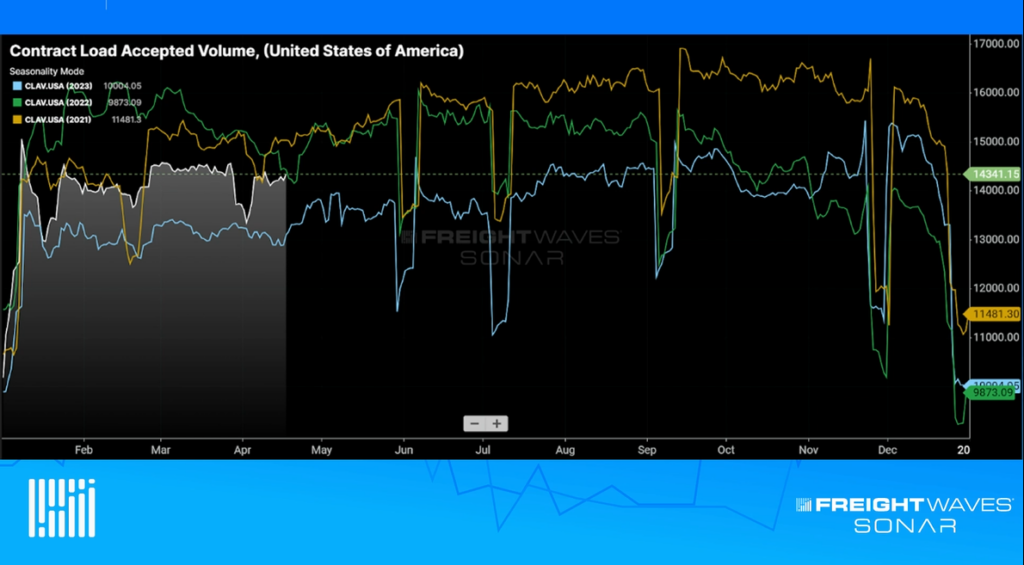
FreightWaves SONAR recently unveiled an update designed to give users new ways to analyze data — especially pricing data.
The FreightWaves Trusted Rate Assessment Consortium (TRAC) includes forward-thinking transportation companies that provide daily transaction data to FreightWaves. This data drives SONAR’s spot rate index, the National Truckload Index (NTI).
“Unlike other rate providers that gather historical invoice data in batches, TRAC is built in partnership with roughly 30% — and growing — of the top 100 brokers and 3PLs that provide actual booking data on every single load booked each day,” the FreightWaves announcement said. “This makes TRAC data far more accurate and reliable than any other spot rate source on the market.”
The newest round of TRAC contributors includes seven of the largest companies in the industry. These partnerships enable SONAR to continue to create new methodologies and introduce innovative tools aimed at building a single source of truth for the supply chain world.
In an effort to continue improving its best-in-class tools, FreightWaves has rolled out a new methodology that enables users to analyze pricing on a key market area to key market area (KMA to KMA) basis. This option will prove especially impactful for customers seeking market-level rates.
While market-level rates have previously been available via SONAR, the platform was not optimized for this specific use case. In the past, market-level rates were calculated from previously aggregated ZIP3 to ZIP3 market rate estimates.
Overall, this method generated solid results. SONAR’s new methodology, however, adds nuance and removes redundancies from its old methodology.
This new methodology ensures loads are only used once and takes length of haul into account. This means that loads within the radius of a given shipment’s origin and destination points will not be used when they create a significantly different length of haul.
SONAR’s new methodology only takes loads within an acceptable buffer of its average KMA-to-KMA distance into account, eliminating anomalies that could have an outsized impact on pricing data.
“KMA-to-KMA rates allow for better trend analysis since they minimize volatility by incorporating more data into each rate. It also limits the distance out from a location that a system may look on a given lane, often creating more accuracy over time,” FreightWaves said. “This provides users with a new way to view rates using legacy systems they may already have in place and paves the way for new, highly impactful customization that will give users additional speed and flexibility.”
Click here to learn more about how FreightWaves TRAC can improve your pricing analyses.


