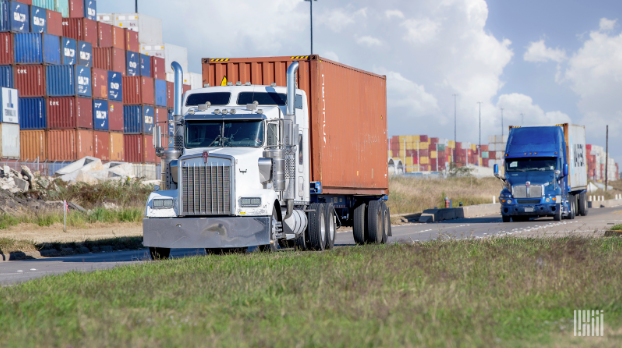
Photo by Jim Allen
Drayage is a tricky market to dissect with a data solution. This is due to the drayage industry being highly fragmented, which makes pricing opaque. Everything from pricing to planning can be limited due to the lack of available intel. Sizeable drayage carriers have told us in recent days that they have seen the smaller independent draymen pricing too aggressively for market conditions, which is keeping rates low.
While SONAR doesn’t contain drayage rates yet, certain data sets provide a look forward at demand that can help carriers be nimble with timely adjustments to rates. Drayage capacity doesn’t typically change much from day to day, but demand can fluctuate based on the volume of containers coming off the docks or into a rail yard.
The SONAR chart below shows why drayage carriers in Chicago should be busier than they were at this time last year. While still below 2022 levels, loaded inbound Chicago intermodal volume (includes containers of all sizes) is up 11.6% year over year since January 1. That is being driven most heavily by loaded inbound Chicago international intermodal volume (primarily 40-foot containers), which is 19.6% above 2023 levels, year to date.
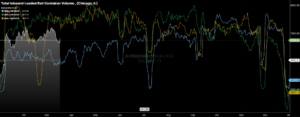
Loaded Chicago inbound containerized rail intermodal volume (includes all container sizes) for 2024, 2023, 2022 and 2021 shown in white, blue, green and yellow, respectively. Chart: FreightWaves SONAR — IRAIL.CHI seasonality view
The data contained in the SONAR ORAIL/IRAIL data set is based on the date that containers are in-gated at the origin terminal. Therefore, it provides insight into drayage demand at the destination terminal in the coming days. About one-third of inbound Chicago intermodal volumes originate in Los Angeles, and intermodal transit time is typically “truckload plus one day” – so an uptick in IRAILL.CHI should translate to an increase in drayage demand in about five days. That’s a heads-up for carriers to source sufficient numbers of chassis and also may provide carriers with the opportunity to be more aggressive with rates in anticipation of a short-term tightening in capacity.
Aside from just looking at total loaded containers inbound to Chicago, draymen can break down that data between international and domestic containers, by specific container size, and by point of origin — whichever is most reflective of a carrier’s customer base.
SONAR data shows that Chicago drayage carriers should be on the lookout for an increase in inbound international containers in particular, which means their customers with growing demand will be container ship lines and/or freight forwarders. It also means that carriers may need to source additional 40’ chassis to service that demand.
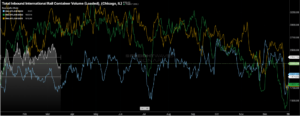
Against a depressed year-ago comparison, loaded international intermodal containers inbound to Chicago are up 19.6% year-over-year since January 1. Chicago inbound international containerized intermodal volume for 2024, 2023, 2022 and 2021 is shown in white, blue, green and yellow, respectively.
SONAR: IRAILINTL.CHI seasonality view
So while the drayage industry may be one of the last frontiers when it comes to data, market players don’t have to be flying blind. Partner with SONAR to unlock leading indicators so that your team can make smarter decisions faster.