In this edition of “SONAR Indices & Insights,” the SONAR team showcases several operational-focused indices to aid asset-lite and asset-based carriers build trucking KPIs that will inform decisions that yield higher profit margins for those who run a trucking business. These indices are in SONAR, the freight forecasting platform from FreightWaves.
This week, learn how executives who manage a trucking business are monitoring carrier operations-based indices to improve profit margins and reduce operational trucking costs. In this article, leaders will learn about five SONAR indices to build trucking KPIs that show where to root out wasted operational costs to improve overall profitability:
What are the SONAR indices that aid in protecting trucking business profits?
There are five available indices that arm trucking business leaders with the data they need to build operational freight KPIs that keep abreast of exorbitant operating costs that are depressing profitability. When leaders are able to track operating costs and understand which factors are yielding a higher operating ratio, leaders are able to make decisions that impact costs and work towards reducing the overall ratio. Since the operating ratio is the overarching index in this set of carrier operational indices, we’ll start by first defining what is the Operating Ratio (OPRAT) index, followed by defining what of the remaining four indices are and what they measure.
Operating Ratio (OPRAT)
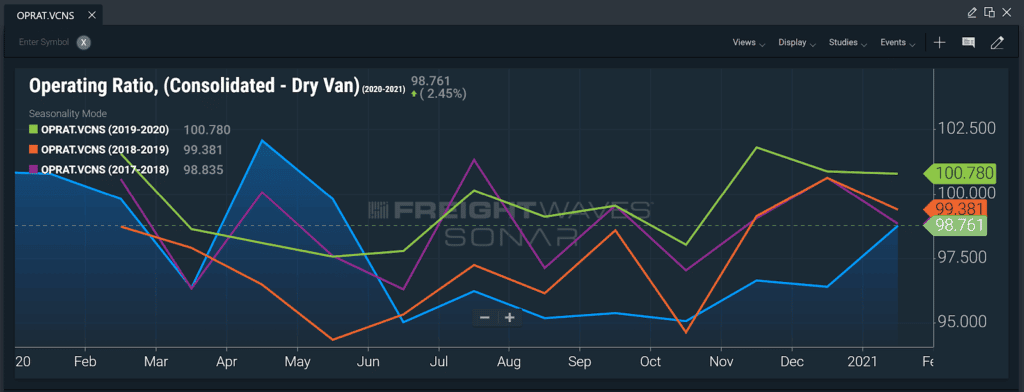
The Operating Ratio (OPRAT) index provides total operating costs divided by operating revenue, which is derived from Truckload Carriers Association (TCA) members and is reported on a monthly basis. OPRAT is segmented into dry van, reefer and flatbed carriers. OPRAT is a measure of how much of every dollar received from customers is spent on moving the freight. Expenses include items such as driver wages, truck lease, insurance, maintenance, etc. Debt servicing is excluded from this calculation. High operating ratios (ORs) are indicative of lower profit margins and ineffective operations or competitive conditions.
An operating ratio (OR) of 101 means a carrier is losing $1 for every $100 it receives from sales revenue.
Formula: Operating ratio = total operating costs / operating revenue * 100.
The SONAR chart above shows OPRAT chart for 2020 as compared to the past three years. As you will notice, there was a large uptick in OPRAT as carriers headed into peak season. You notice another spike as the industry saw increased volatility in Spring of 2020 due to the COVID-19 pandemic.
OPRAT is divided into the following granularities:
Dry van company fleet – VCF
Reefer company fleet – RCF
Flatbed company fleet – FCF
Dry van company and leased fleet – VCFOO
Reefer company and leased fleet – RCFOO
Flatbed company and leased fleet – FCFOO
Brokerage divisions for dry van, reefer and flatbed – VBR, RBR, FBR
Consolidated for dry van, reefer, and flatbed – VCNS, RCNS, FCNS
Watching carrier ORs can be useful in identifying the health of the trucking sector. When ORs are too high (over 100), carriers may be more willing to take lower-priced freight but are at a higher risk of parking their trucks and leaving the space. Lower ORs are indicative of carriers with a well-run trucking business, but also stronger market conditions in which freight rates are elevated. Having insight into the trucking sector’s health allows you to see if you or your carriers are in a strong or soft market.
Gross Fuel Expense Per Mile (GFEMIL)
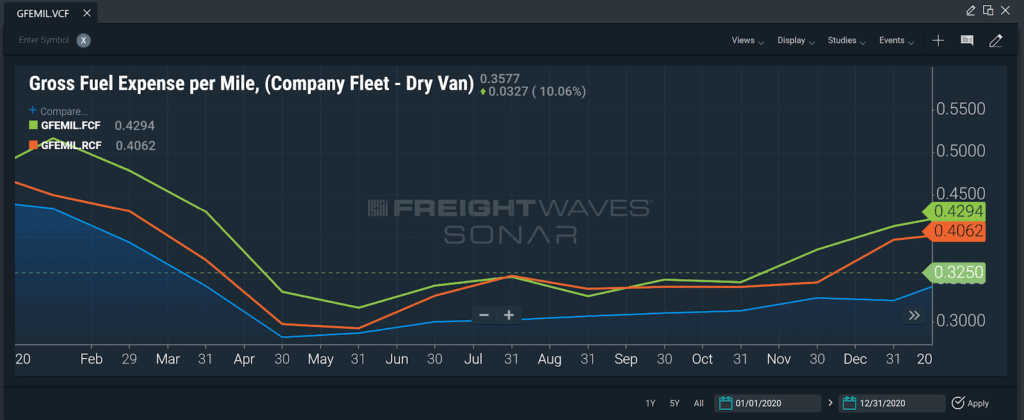
The GFEMIL is an index that measures the total fuel consumption expenses associated with all moves and is expressed on a per-mile basis. That includes total fuel costs for purchasing rack diesel fuel price, fuel additives, diesel exhaust fluid and taxes. The formula applies to a trucking business with fleets of any size and provides an industry standard for benchmarking. Carriers reporting this data are members of the Truckload Carriers Association’s TPP Program.
Formula for GFEMIL: Gross fuel expense per mile= (gross fuel purchased + fuel additives + diesel exhaust fluid + taxes) / (odometer miles end of period – odometer miles beginning of period).
The SONAR chart above shows the GFEMIL index compared in the three equipment types: dry van, reefer and flatbed. Using SONAR, leaders at a trucking business could also benchmark GFEMIL to prior years to see how GFEMIL has changed over time.
The GFEMIL captures the gross fuel expenses of a carrier or broker and breaks down the costs into a per-mile rate. That provides insight into the total fuel costs associated with each mile of transportation. As a result, carriers are able to identify whether their loads are trending in a negative direction (increasing GFEMIL) or positive direction (decreasing GFEMIL), recognize when to assess new fuel surcharges and stay proactive.
Percentage of Gross Fuel Expense (%) (GFEPCT)
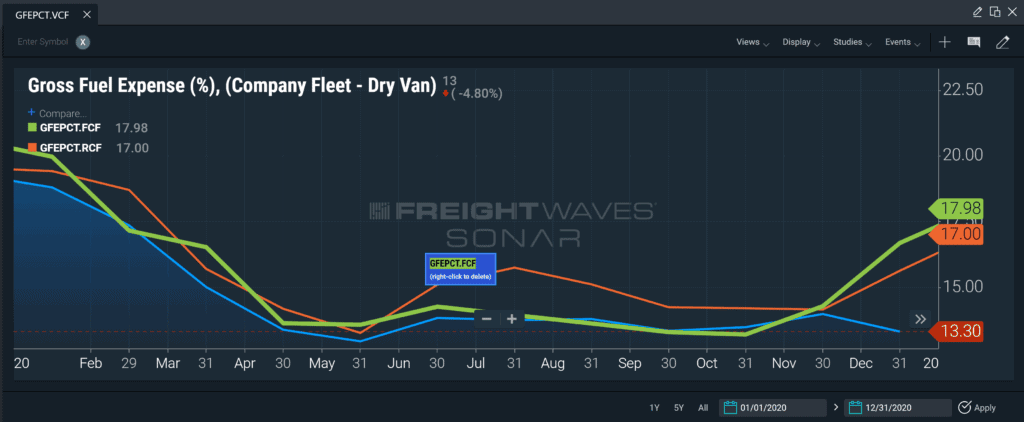
The Percentage of Gross Fuel Expense (%) (GFEPCT) index provides insight into the total fuel costs in comparison to total revenue. In this case, a lower GFEPCT indicates higher profit margins through lower fuel costs for the trucking business. Carriers reporting this data are members of the Truckload Carriers Association’s TPP Program
The formula for Percentage of Gross Fuel Expense (%) (GFEPCT) is as follows: Percentage of gross fuel expense = (gross fuel purchased + fuel additives + diesel exhaust fluid + taxes) divided by operating revenue * 100.
The SONAR chart above shows the GFEPCT index compared in the three equipment types: dry van, reefer and flatbed. Using SONAR, leaders at a trucking business could also benchmark GFEPCT to prior years to see how GFEPCT has changed over time in each equipment type.
The GFEPCT index is a model of how well a carrier performs. The higher numbers mean a trucking business is losing more money per load as a percentage and can identify their total losses deriving from fuel costs.
Percentage of Insurance Expense (%) (INSURE)
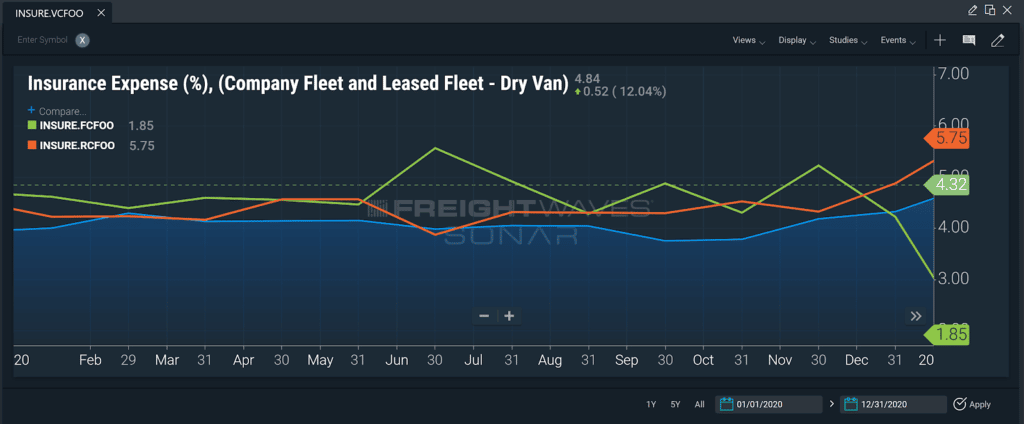
The Percentage of Insurance Expense (%) (INSURE) index expresses the total insurance expense related to the delivery of a load on a percentage of revenue basis. The data components of this index, reported by carriers, include Physical Damage Insurance (premium and deductibles), Cargo Insurance (premium and deductibles) and Liability Insurance (premium and deductibles). Insurance expense also includes any self-insured accident/driver damage. The expense is calculated relative to total trucking business revenue (linehaul and accessorial revenue). The carriers reporting the data for this index are participants in Truckload Carriers Association’s TPP program.
The formula for INSURE percentage is as follows: [insurance expense / (Linehaul revenue + accessorial revenue)] multiplied by 100.
The SONAR chart above shows the INSURE index compared in the three equipment types: dry van, reefer and flatbed. Using SONAR, leaders at a trucking business could also benchmark INSURE to prior years to see how INSURE has changed over time in each equipment type.
In aggregate, the INSURE measure is a lagging indicator of carrier safety performance, and the availability/capacity of insurance companies and coverage within the for-hire trucking business space. A large percentage of carriers included in the reporting dataset self-insure a portion or all of the risk associated with the coverages disclosed above.
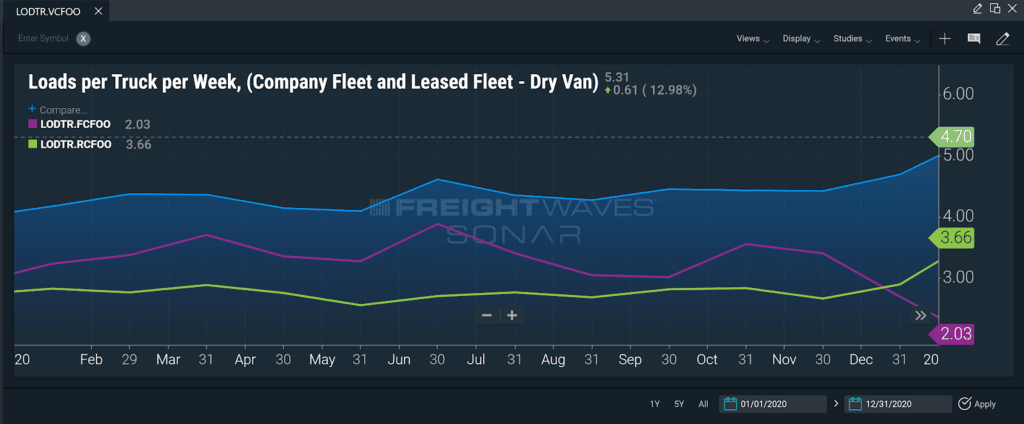
Loads Per Truck Per Week (LODTR)
The Loads Per Truck Per Week (LODTR) index displays the total number of accepted freight loads, delivered by carriers, expressed on a ‘per truck’, ‘per week’ basis. Carriers reporting data for this index, provide a truck count whether seated or unseated. If the truck is plated by the carrier, it is counted. As such, those running a trucking business with a high % of unseated tractors will be penalized in the form of a lower relative result. The carriers reporting the data for this index are participants in Truckload Carriers Association’s TPP program.
The formula for LODTR is as follows: (load count/truck count) / number of weeks in the month.
The SONAR chart above shows the LODTR index compared in the three equipment types: dry van, reefer and flatbed. Using SONAR, leaders at a trucking business could also benchmark LODTR to prior years to see how LODTR has changed over time in each equipment type.
The LODTR index provides a measure of performance and health for the truckload segment. Higher results, relative to historical values indicate a strong trucking business market. Conversely, lower measures indicate weaker economic activity. The LODTR index is widely used by carriers as a transportation KPI. In robust freight markets, there is a tendency for carriers to reduce the geographic footprint of their freight network, thereby lowering the average length of haul, and increasing the number of loads per truck per week.
Build smarter data-driven trucking business by purchasing and using SONAR
In turbulent times, asset-based and asset-like trucking business leaders need certainty to stay ahead of the freight market and understand the impacts any current market is having on operations. The premier freight forecasting engine, FreightWaves SONAR, allows carriers to benchmark, analyze, monitor and forecast operating costs in an effort to increase profitability.
SONAR ensures more proactive responses to the market, provides correlations between several indices to guide decisions and builds a smarter data-driven trucking business. Click the button below to get a demo of SONAR to see what the platform can do for you.