We’ve had some exciting developments in the works over the past few months and are happy to explore a couple of new updates to make SONAR users’ experience even more valuable. From improved search capabilities to AI-powered forecasting, the last few releases truly have something for everyone. No other freight company spends more time and energy investing in fine-tuning and improving the data and tools our customers use every day, and we’re excited to bring these new features and updates to you.
SONAR has over 200,000 available data sets, so finding the exact ones you need can seem overwhelming. Our data engineering team has worked to streamline the process of finding the data sets you need by not only consolidating from 24 categories to 8 categories, but also enhancing the ticker search capabilities within our SONAR UI. Users now benefit from being able to quickly access data when building out their custom pages. And to top it off, we went one step further and created a Widget Selector landing page. This landing page provides images, descriptions and tutorials to help make it easier than ever to select your preferred visualization of the data for quicker analysis.
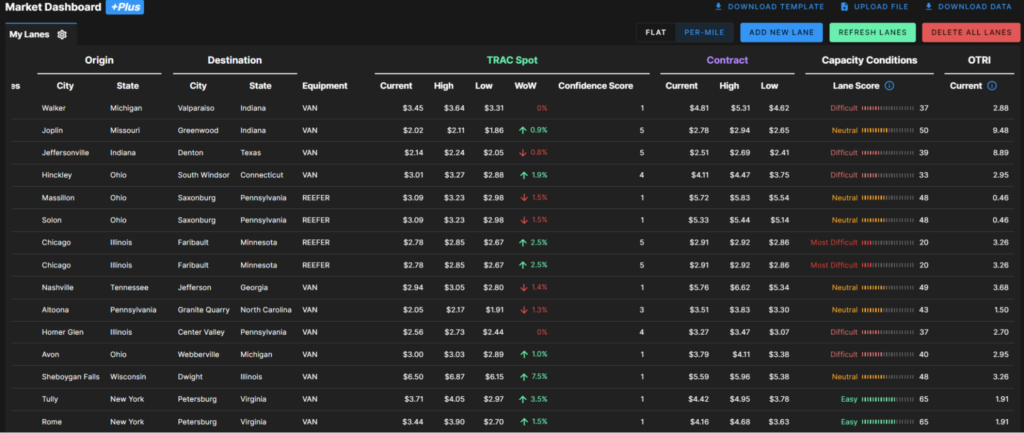
Our Trusted Rate Assessment Consortium (TRAC) has been an integral part of producing a multitude of data sets and features to provide our customers with the most transparent and reliable spot market data available. We are able to provide van, reefer and now flatbed rates! SONAR customers have the ability to not only search flatbed rates in our Market Dashboard (single-lane search tool), but also manage bulk pricing of flatbed, van and reefer lanes directly in the SONAR user interface with Market Dashboard Plus+. While our customers have been sharing great feedback so far about the ability to price flatbed freight using TRAC API data, you can now price more lanes with more insights even faster by having the data accessible within the SONAR UI.
Now, imagine being able to look at a map and immediately understand where rates are most volatile. Our data engineering team has brought this dream into reality with the Market Conditions map in Market Dashboard. This new feature provides a heat map of markets where rates are either increasing or decreasing more often so that you can adjust pricing and budget accordingly.
Wouldn’t it also be nice to benchmark your rates to the current market and know how rates are changing, all at the same time? Exclusively for our TRAC contributors, we have introduced myTRAC, a customized suggested bid rate, which brings benchmarking to a whole new level. MyTRAC, available only in Market Dashboard, now enables users to compare their rates to the current market, identifying opportunities for cost savings and helping inform their rate decisions.
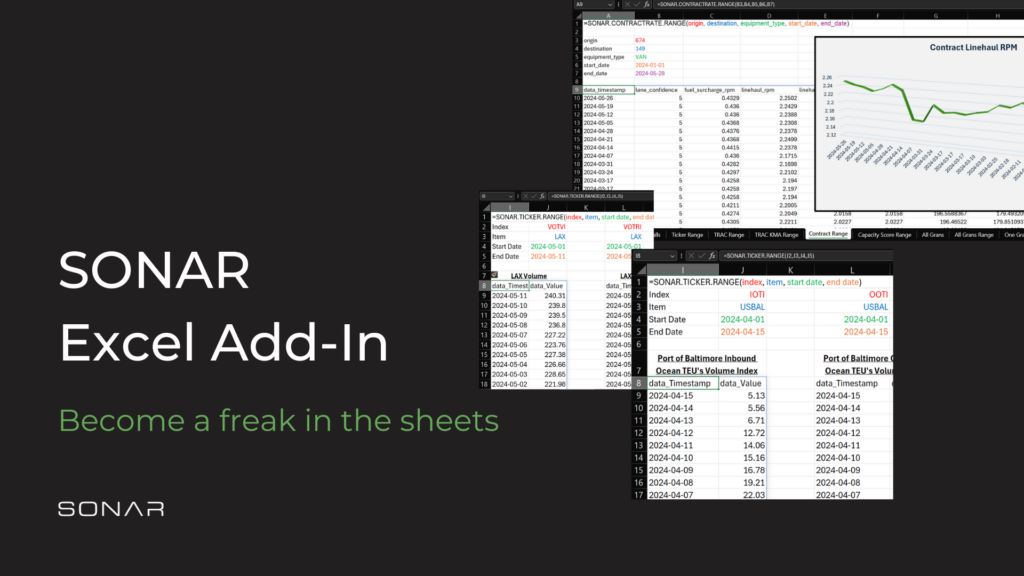
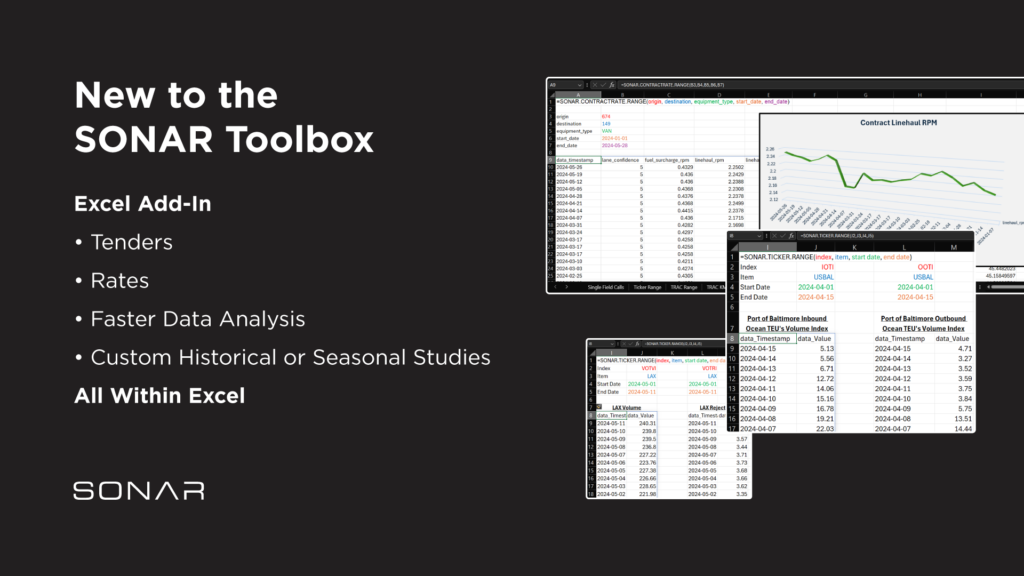
And for one of our most exciting releases to date, we are thrilled to announce the availability of the Excel Add-in, which allows customers to choose the SONAR data they want to export into Excel — without the need to get IT teams involved. Procurement and finance teams will love the ability to view, streamline and aggregate the data they need to analyze alongside their other metrics for enhanced efficiency, all within Excel.
This is just a small list of the most recent enhancements we have made for our SONAR community, but much more is on the horizon. For example, coming soon is our new Compliance Curve feature, exclusively for SONAR SCI (Supply Chain Intelligence) customers. Service levels and compliance are always important, and so is the ability to evaluate the value of your transportation spend while balancing cost and service metrics. Compliance Curve will help optimize the price you pay for the service levels you need.
We will never stop investing time and energy into enhancing the data and tools our customers utilize every day to enhance communication, visibility, efficiency, consistency and flexibility!
Explore more of what SONAR is offering on our release notes page here!