The adage goes, “It takes a long time to become an overnight success.” It’s also a long road to meet just-in-time delivery. For years prior to the pandemic, the consistency and integrity of global trade lanes meant that the industry viewed costs and lead times as assumptions rather than obstacles, especially as each generation of cargo ship has grown ever larger.
The pandemic highlighted how fragile and extensive the supply chain truly is. This piece from late 2021 regarding Halloween supply chain planning shines a spotlight on this fragility and highlights the real costs of delay and disruption. Although our vampire and Paw Patrol costumes are bought off of a rack in September, they’re expected at the ports by May or June.
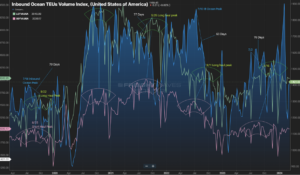
Lead times vary across product categories, depending on their time to manufacture, grow or ship in order to meet demand. But in aggregate, patterns become evident within the data. Below is a five-year seasonal view of inbound ocean tender volumes to help establish patterns. The blue line demonstrates the disruption brought on during the early stages of COVID (as compared to other years), beginning with the initial shock, followed by a spike in demand brought on by the government stimulus. But seasonal trends continue after Thanksgiving, with orders cut for springtime seasonal shipments before much of Southeast Asia shuts down for at least a week for Lunar New Year in late January/early February.
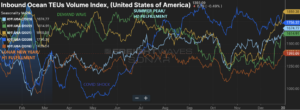
By July, ordering is in full swing for the holiday season, typically reaching maximum height around Independence Day. Understanding these broad mechanics allows one to gauge seasonal trends and make projections in advance by the nature of their lead times. A voyage from Asia to the West Coast typically takes two weeks to sail while East Coast legs are a week or two longer. Once at port, containers are brought inland to a rail yard, prepared to move again or placed in a warehouse. Considering the time to sail and position, more than a month is spent setting the stage for the first mile.
Thereafter, the middle leg routes the freight to any number of distribution or fulfillment centers within the country. This is normally the longest part of the journey domestically. Although Cincinnati may be within a day’s drive of 60% of the population, it lies 2,200 miles from the Los Angeles and Long Beach ports, where more than a third of US imports originate.

Finally, once nestled into these centers, orders are ready to make their final mile journeys at least a week or more prior to the actual holiday. St. Patrick’s Day is seven days from this writing, but a look back shows that your “Kiss Me, I’m Irish” t-shirt was actually in the store in January or February and arrived at the port in November or December.
This connection is reflected in SONAR tender volumes by lengths of haul. Although upstream ordering peaks during the summer holidays, the final mile is king downstream, as evidenced by the annual run of short hauls (101-250 miles) between Memorial Day and July 4, with the 2021 period being the previous pinnacle of the goods demand cycle.
Conversely, longer-haul (800+) moves of the middle mile reach their low points for the year during this time as they sit in a lull between H1 fulfillment, beginning in late March and running through the start of each fall. As you can see, there is a 65-75 day lag between those ocean tender highs in July and the salmon run of truckload middle-mile moves later in the summer. A similar time frame sits between end-of-year ordering and the H1 fulfillment period in March.
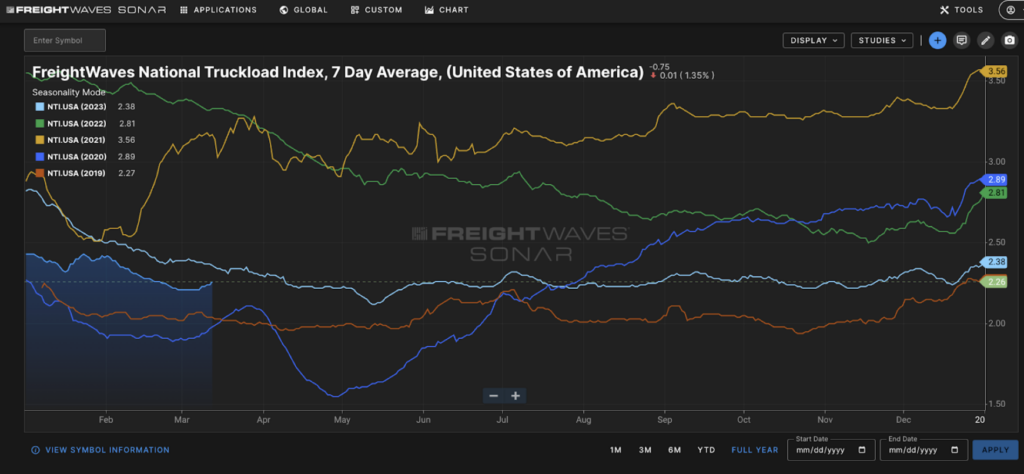
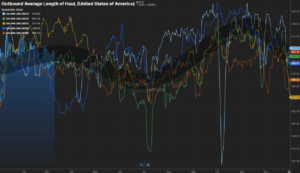
These trends denoting the positioning of inventory show up in the average length of haul, as seen below, both in annual patterns and stark diversions seen with the initial COVID impacts illustrated above. They also have some influence on rate per mile trends through the year as rates typically spike at the bookends and midpoint of the year while sinking lower during the middle-mile periods.
There is much more to consider for any particular category, port or area of the country, but understanding these key dynamics within the US at a high level can help set expectations for the trajectory of truckload markets well in advance. This is where SONAR customers have the advantage: they have a clearer view of the current recovery starting from last summer as ocean tender volumes finally returned to parity with the year prior in August, held on for a while, and then inflected in September. Lo and behold, around two months later, outbound truckload tender volumes moved close to the levels of the prior year and then also inflected the month after.
By following maritime data and pairing it with multimodal domestic trends (volumes, rejections, etc.), only SONAR users are equipped with true forecast capabilities to strengthen real-time decision making for their supply chains.