
Supply chain optimization is often presented as a choice between resilience and responsiveness — between being able to withstand and operate normally under conditions of disruption and stress and being able to quickly flex capacity and throughput up or down opportunistically.
“Resilience” can sound like redundancy, contingency planning, higher operating costs and underutilized capacity waiting for a crisis, while “responsiveness” might be mistaken for labor-intensive firefighting and active management of emerging situations that places a high premium on human creativity.
But when supply chain leaders tackle these problems with digital tools, they find that resilience and responsiveness often go hand in hand. High quality data connected in the right way can dramatically improve the speed that information propagates through an organization and accelerate the cadence of decisions. Those capabilities, in turn, allow a company’s supply chain to navigate disruptions like capacity shortages, demand shocks, and supplier delays more easily.
Here’s a small-scale, tactical example: a truckload shipment inbound to your distribution center is running late. The truck will miss its appointment, dwell at the facility for a day, and the product in the shipment isn’t available to be sold or shipped to a customer. Supply chain teams that have real-time transportation visibility data connected to their warehouse management systems and appointment schedulers can automate how dock appointments are built and modified. They can mitigate the impact of a shipment delay and efficiently utilize their own workforce.
But digital tools can deliver more meaningful results when they’re part of a larger strategy aimed at what McKinsey has called “structural resilience”: “As the frequency and magnitude of the disruptions increased, applying ad hoc remedies to restore predictability to a system premised on ever-increasing cost optimization became more difficult. To restore the needed resilience, supply chain operators may need to consider a range of options, including structural reform.”
Structural resilience can involve integrating data at a higher level, across business divisions like supply chain and sales and operations, to make sure that supplier networks, logistics providers, inventory managers, and customer-facing endpoints like distribution and fulfillment are all on the same page.
Here’s a recent example: in June 2020, as goods purchasing spiked and businesses experienced pronounced surges in demand, real-time freight market data revealed that trucking carriers across the country were rejecting shipments more frequently, signaling an underlying lack of capacity.
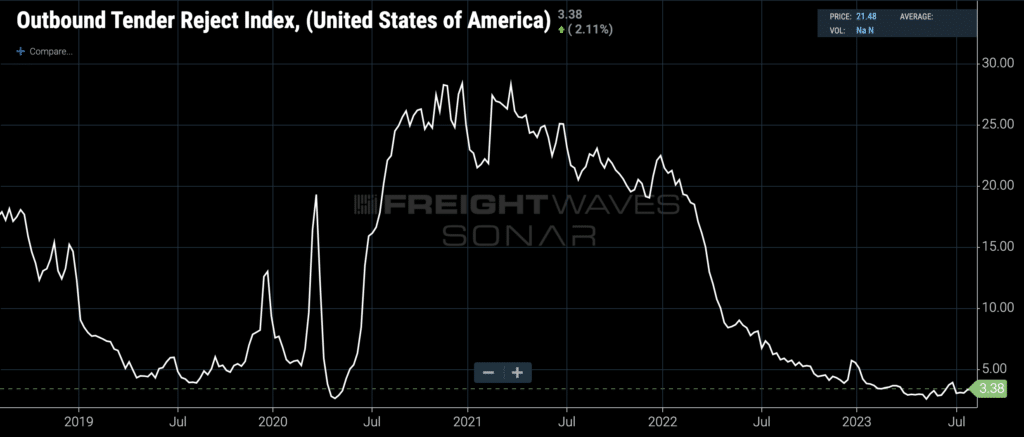
(The Outbound Tender Reject Index measures the percentage of truckload shipments tendered by shippers that are rejected by carriers. Chart: FreightWaves SONAR. To learn more about FreightWaves SONAR, click here).
When the Outbound Tender Reject Index (OTRI) hit 20%, it was clear we were at the beginning of a sustained capacity crunch in transportation and that all parts of the supply chain would come under increasing pressure from unusually high demand.
By benchmarking their own carriers’ service against third-party market data like OTRI, a shipper could monitor their network’s relative performance. If the shipper’s truckloads were getting rejected at higher than acceptable rates, it could automatically reprice shipments for the spot market and target a list of contracted lanes for rebidding.
As capacity tightened in key markets like Los Angeles, Dallas, Chicago, Atlanta and Harrisburg, retailers, manufacturers and distributors using FreightWaves SONAR could proactively communicate with their transportation providers and adjust rates and SLAs when volatility appeared.
Pairing OTRI with spot and contract rates and benchmarking their supply chain’s performance on multiple dimensions against the market gave shippers an even greater advantage during the pandemic and its aftermath. Shippers could hug the prevailing market rate with confidence, neither overpaying in loose conditions nor underpaying in a hot market (which would introduce service risk).
FreightWaves SONAR’s rate data comes with multiple attributes, like high/low ranges and confidence scores, to empower shippers’ algorithmic decision models. In previous generations of transportation rates, a human expert was needed to ingest the rate and place it in its appropriate context — how much volatility is the lane experiencing? Is the market headed up or down? How fast might this rate change?
But the SONAR’s TRAC rate data — TRAC stands for “Trusted Rate Assessment Consortium” — provides the rich context needed for true automation to take place. Recent integrations with FreightWaves SONAR customers feed into business logic decision layers that treat rates with high or low confidence scores differently, sometimes making simple adjustments to the rate and in some situations, returning a range instead of a single rate, to account for expected volatility.
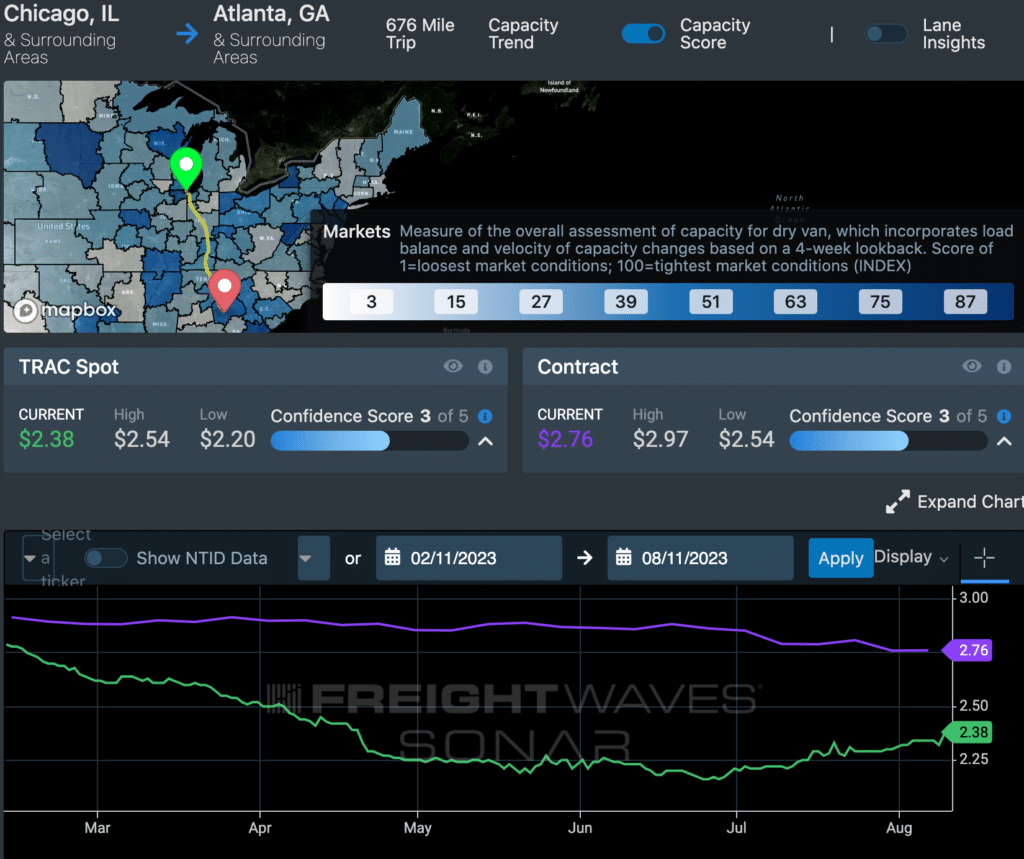
(Screenshot of Market Dashboard+, a FreightWaves SONAR app that displays numerous truckload rates, including TRAC. Image: FreightWaves SONAR.)
Fast, clean, contextual third-party data can enrich your supply chain team’s understanding of the current state and speed up their communications with colleagues, including finance and sales and operations. FreightWaves SONAR has that data: rate, bookings and capacity information in multiple modes that can be easily analyzed on multiple dimensions.
To start a conversation about how FreightWaves SONAR’s data can make your supply chain more responsive and resilient, click here.