In recent years, many transportation media outlets have focused their sites on explaining when to balance spot market freight rates with contract market rates. The allure sounds simple. Finding the right balance between the two allows for the most affordable freight budget. However, the supply chain is rarely that simple. In general, shippers, carriers, brokers and forwarders tend to follow similar patterns when assessing the spot versus contract freight market. Remember that all freight is bought and paid for on spot, so even in the best of circumstances, the spot market influences contracted rates too. Spot market freight is highly dependent upon available freight capacity in addition to many other data points. Therefore, companies need to realize the real potential is turning to the spot market freight data to understand what’s happening in the overall market.
Where do shippers go wrong using spot market freight data
Misunderstandings about spot market freight data and contracted freight are relatively simple. A contract rate is a price that a carrier and 3PL agree on to move a shipper’s freight in a set lane over a set period. Contract rates offer the fixed-term (usually a year) security of both price and capacity. Locking in a rate for a year can be a gamble because the market could shift one way or another and carriers can get stuck with a reduced load or win big with a great rate while the market is down. Spot rates can be easily understood by applying the fundamental economics of supply and demand. This is a good starting point, but freight shipping is a bit more complicated than that. Major misconceptions arise when shippers assume it is one or the other. Spot market freight rates that are increasing tend to attract more drivers. But the problem is about to get much worse for those that do not understand how to consider the holistic view of the real market rate.
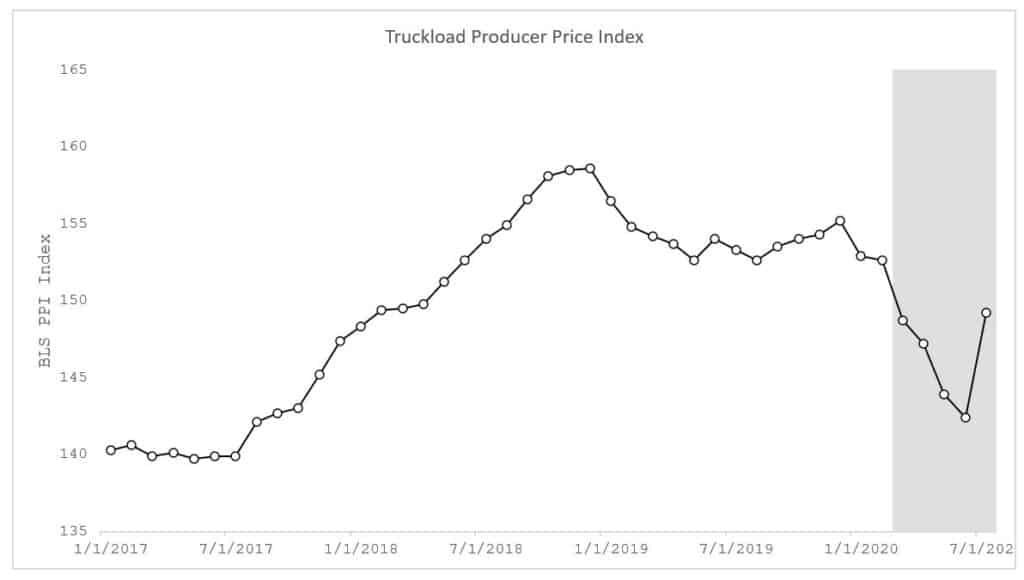
Part of the disconnect arises when companies fail to realize that all freight technically carries some form of spot rate influence. In a rising market, less desirable lanes have the highest rejection rates and vice versa. Even as the market appears to be on the rebound as shown in the graphic, it remains below the July 2019 peak. Therefore, the market for contracted rates is still unstable. Even worse, the balance of rating power between spot and contract freight remains. Spot rates tend to reflect the inverse of the contract rate. Yet, they are both increasing in the current market. As a result, it’s not just a decision of which spot or contracted carrier to use. That’s limiting way too many options.
Another issue exists when shippers fail to recognize that different types of bids exist. The traditional bid is based on a contract and allows a company to offer a set rate for a fixed volume of freight or lanes. Meanwhile, mini-bids are like short-term contracts, allowing shippers to rebid with carriers to try and capture a better-contracted rate based on the market. Dedicated service bids are those involving private fleets that come with driver restrictions to ensure a company can always meet demand, even if at a higher cost. And lastly, the spot market revolves around the oddities or one-off shipments that are inconsistent and subject to sudden changes in demand. Given what we know about the overall market, the sudden changes in demand will inherently drive more interest in contracted rates. When does a company with an existing contract re-evaluate that contract or move to another bid for a set lane or other metric? That’s where having access to more freight data adds the most value.
Analysis of historical and real-time freight data provides insights into true market conditions
The correlation between spot and contracted rates is subject to change. Drivers who are independent owner-operators are more likely to abandon working with carriers when spot market freight is more attractive. There is one exception to this fact. Drivers that work for a carrier and are not independent owner-operators and are on an active non-compete contract will stay with the appropriate carriers. However, this is the age of the gig economy. A non-compete clause is almost a death warrant for any carrier trying to attract more drivers. So, again, even taking advantage of contracted rates brings back the topic of spot market freight. Why is that important?
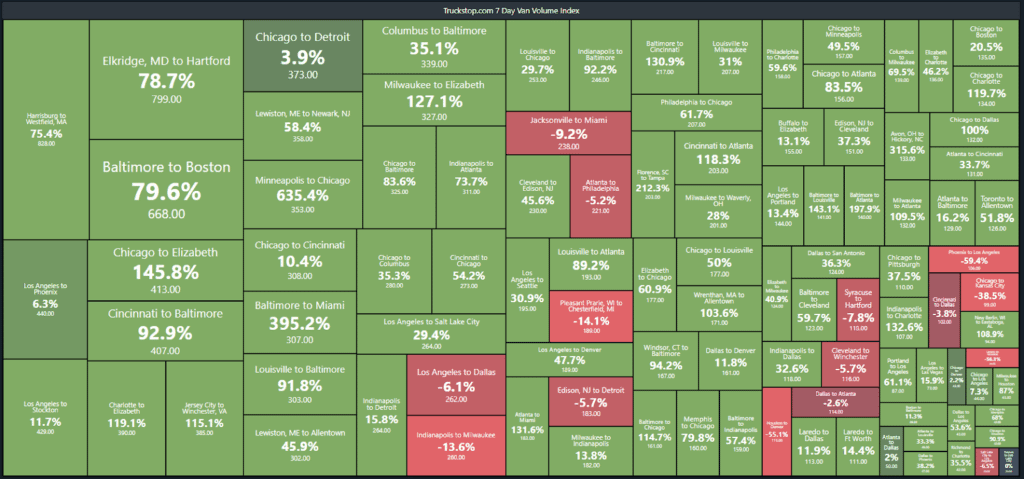
All freight rates, regardless of lane, origin, or destination, reflect the market’s real volatility. Understanding spot market freight provides insight into the true market conditions. Spot market freight data analysis can help shippers recognize trends within the market before they materialize. SONAR users turn to the Truckstop.com 7 Day Volume Index along 103 of the most heavily trafficked lanes in the Truckstop.com Rate Analysis Tool database. The rates are available for Van (TSTOPVR), Reefer (TSTOPRR), and Flatbed (TSTOPFR) modes. These weekly average rates are updated each Monday morning. FreightWaves research indicates that on any given lane, the highest and lowest rates in a single day can be hundreds of dollars of difference. Between FreightWaves own predictive freight rates, and the rates gathered by a respected brand like Truckstop.com, SONAR users now have an extra data point to aid rating decisions.
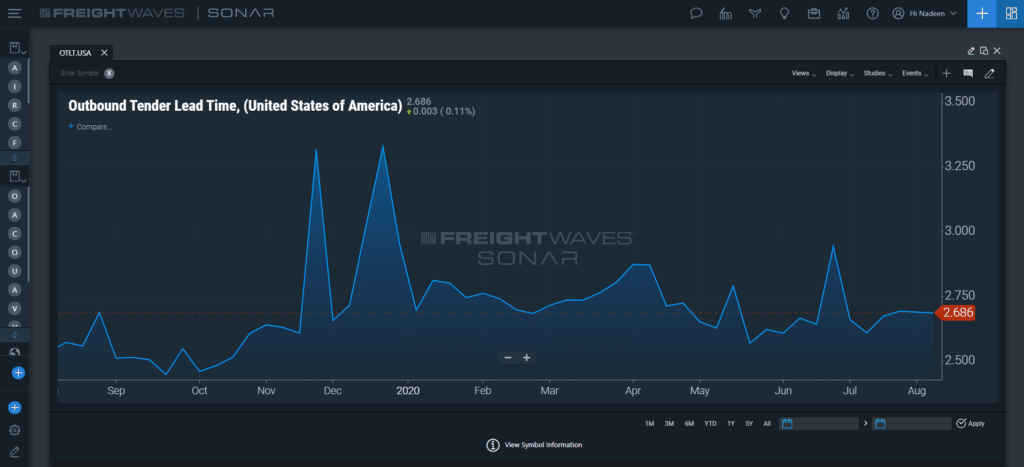
For example, a relatively simple metric, the Tender Lead Time Index, also available within FreightWaves’ SONAR, tracks the amount of time that passes between the initial offering of a load and its acceptance or pickup by a carrier. As the lead time shrinks, the opportunity to make an informed decision on whether to take advantage of available spot rates or available contract rates. In the age of same-day, if not the next day delivery doesn’t provide much insight. Only by understanding spot market freight rates in comparison to the whole industry can an organization recognize where the real opportunities for savings lie.
Using spot market freight data derives more value and better manage resources
Utilizing spot market freight data to derive more value from the supply chain is not only hard facts pointing to the true freight market rate that shippers/brokers should pay and indicates what carriers should price. It includes multiple visualizations and graphic capabilities that allow a user to immediately review all available lanes for a given shipment and make the best decision based on the total customer service levels.
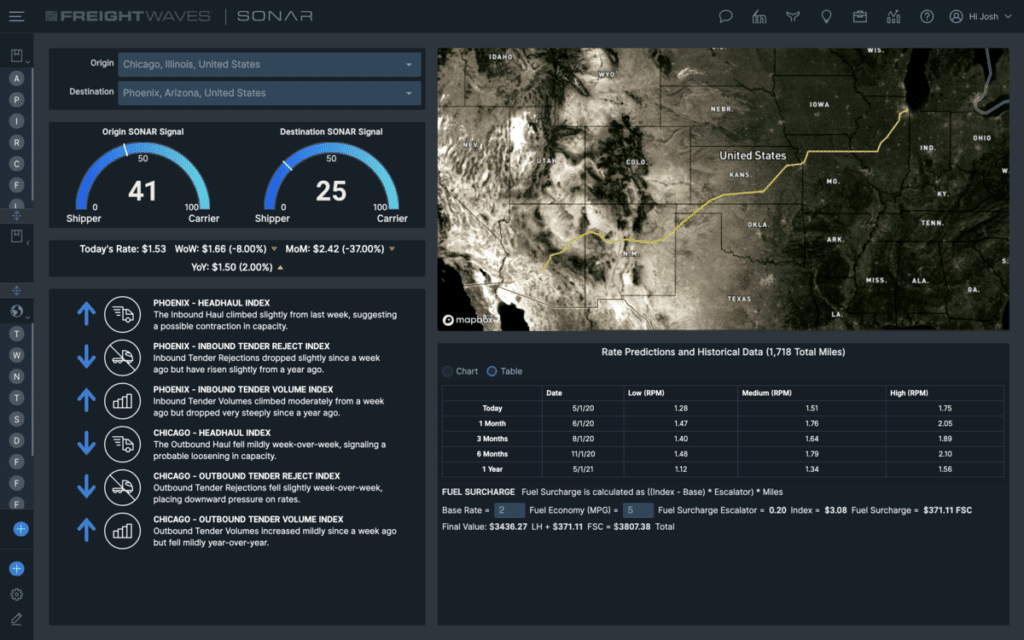
For example, utilizing SONAR’s Lane Signal app to measure the value for one lane over another broadly allows for better management of resources based on the most profitable opportunity. Applying spot market freight data to make an informed decision is not only about getting the best cost rate. It includes ensuring the service level for the given shipment is appropriate.
Since market volatility will always reflect the supply and demand of carriers and capacity, tracking this level of volatility in more granular and broad strokes enables proactive planning and informed decision-making. In turn, carriers and shippers can better place or request bids, avoid under- or over-estimating their shipping costs, and they can finally select the right lane and carrier based on meaningful data, not an arbitrary assumption about whether a spot or contracted rate is the right path for that particular shipment.
Tap the potential of informed decision making and with SONAR
The modern supply chain is growing in complexity and size. The best data scientist on the planet could not realistically compile, analyze and present the volume of data that an advanced freight forecasting platform can provide. That’s not technically true. With enough time, they could. However, time is the essence of the modern supply chain. It is time for supply chain executives to act and implement a freight forecasting platform that provides actionable insights to help shippers make decisions on carrier, lane, mode, possible disruptions, and more. SONAR is that solution. Request a SONAR demo online today.