The Average SONAR customer archives return on investment through four key areas
4-10% Transportation Cost Savings
Leading shippers see $10MM+ in savings opportunity when benchmarking and analyzing their current supply chain
Up to 5% Increase in Tender Acceptance
Improving route guide compliance is critical to maintaining savings, customer retention, and a strong carrier network
200+ Hours Saved Per Year
Transportation, finance, and procurement teams see greater alignment and gain operational efficiencies
2-4% Increase in Org-Wide Efficiency
Strengthened carrier relationships, greater transparency across the organization, improved forecasting, and increased performance
What's the SONAR ROI?
Use our calculator to find out.
By increasing the number of loaded miles per day your drivers drive by 1% and your rate per mile by $0.03 you will make more per week #WithSONAR.
#WithSONAR you can save up to per week through better bid negotiations and more effective management of your routing guide.
#WithSonar you can add 1 more load per person each day and increase $5 margin per load, earning your company an extra per week.
Disclaimer: Every company’s circumstances are unique. Fixed and variable expenses, market conditions and operational factors vary. Unforeseen events may also affect results. Calculated potential results reflect the consensus expectation of FreightWaves’ experts. Actual results may vary.
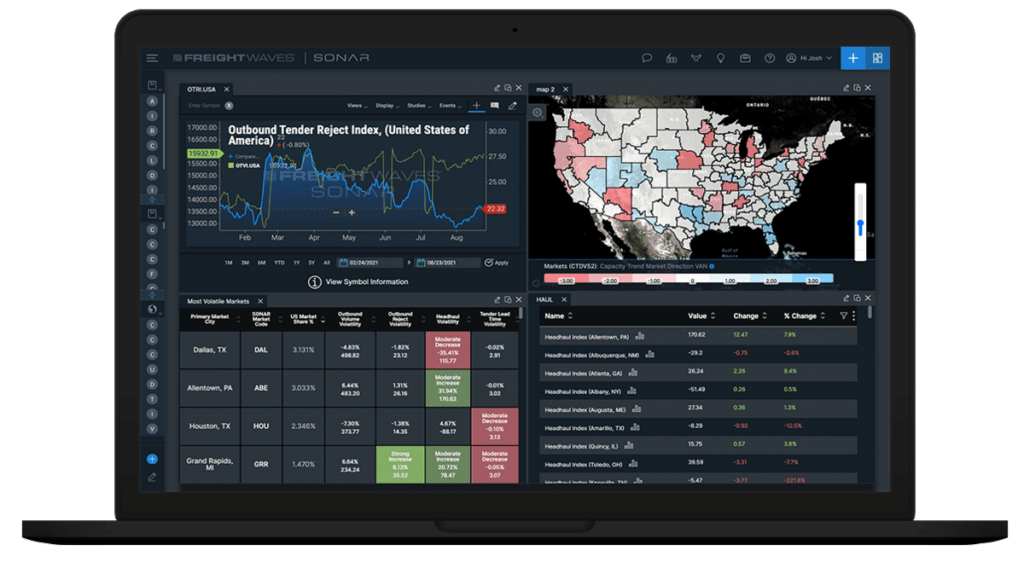
Boost Benchmarking and Reporting with High Frequency Data
Stay on top of supply and demand dynamics across all modes of transportation with SONAR’s best-in-class data and analytics.
Access data from over $200 billion of transportation invoices
See how fast freight volumes change across markets, lanes and regions
Gauge available capacity with confidence using Tender Rejection Indices
Access exclusive tender data and identify cost-saving opportunities in your network
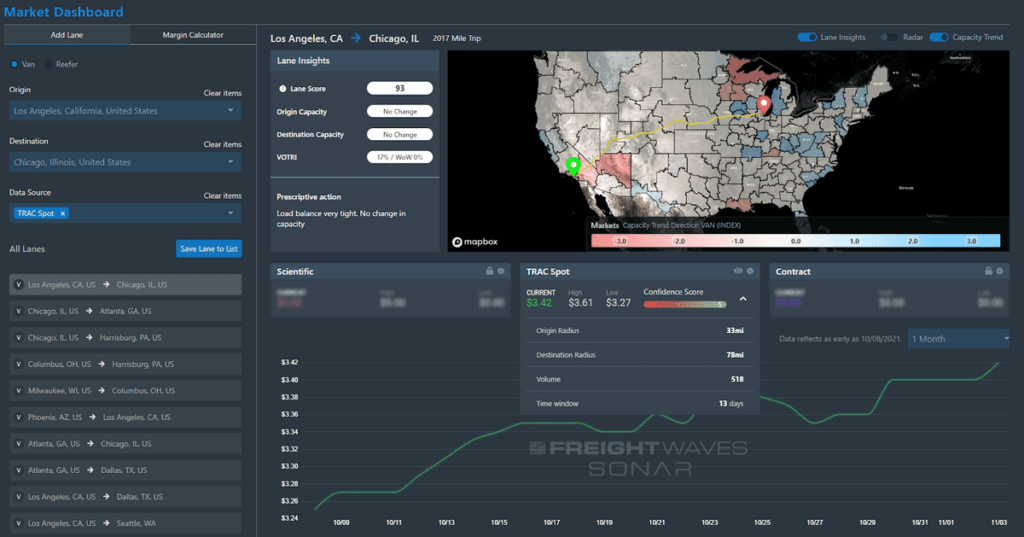
SONAR offers users the fastest truckload, intermodal, and ocean container data, collected at the point of booking, to provide granular insights into transportation costs and carrier service.
Analyze contract and spot rates paid out to carriers from freight invoices collected every night
Understand lane-level tender acceptance trends to hold carriers accountable
Identify opportunities for targeted mini-bids to reduce cost and improve service
Increase carrier compliance
Benchmark yourself against the market to create bottom line competitive advantages