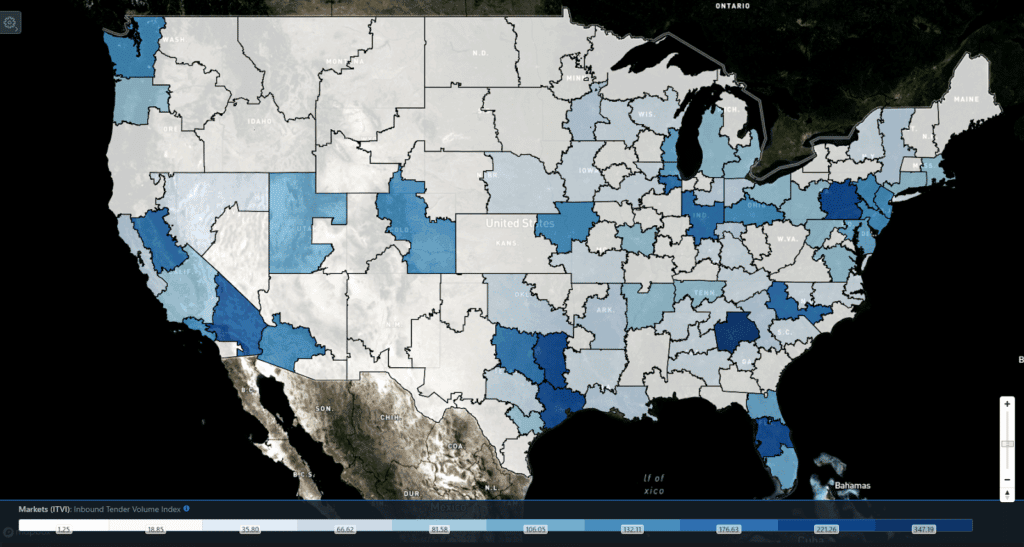
How does ITVI Work?
A tender is a load offer to a trucking company that is sent electronically. These are actual loads and are transmitted a few days before they are scheduled to be picked up. Tenders are the most current and reliable indicator of market demand.
The FreightWaves SONAR inbound tender volume index (ITVI.USA) shows users which markets the tender load volumes for the U.S. are delivered into. Very similar to the outbound tender volume index (OTVI), which shows SONAR users which markets are loading the freight, ITVI uses the same load tender data, but uses the destination as its basis to measure inbound freight volumes. Users can also drill down to specific regions and market granularity. SONAR users can utilize the chart feature to see how ITVI has trended over time. Users can also use the map feature to give a high elevation view of which markets have the most freight.
Who needs the Inbound Tender Volume Index?
Carriers: Changes in inbound tender volumes can increase or decrease trucking capacity in a market, or region. ITVI will help carriers understand more about the market conditions in different regions of the nation, which can help with decisions on accepting or declining loads that are offered to them.
Brokers & 3PLs: ITVI can help brokers see the flow and transfer of freight across the nation, and identify markets they need to target. For example, high inbound volumes into Atlanta will likely lead to outbound loads into the southeast region. ITVI will also help brokers measure market conditions on both the markets they are working in, and destination markets enabling them to optimize their rates.
Shippers: ITVI will help shippers view inbound trucking capacity into their market. Changes in the number of inbound trucks will help shippers react to market conditions proactively to ensure their loads are covered.
What Can User of SONAR do with the ITVI?
The ITVI was built to help users identify inbound freight volumes that are shipping at a national, regional or market granularity. Users can view this data on a U.S. Map, Heat Map or Chart to help them understand which markets are receiving the most freight, or in other words, which markets are receiving trucks that will soon be available. SONAR users will be able to gauge if a market they are investigating is in need of additional capacity, or saturated with trucks that are searching for outbound loads.
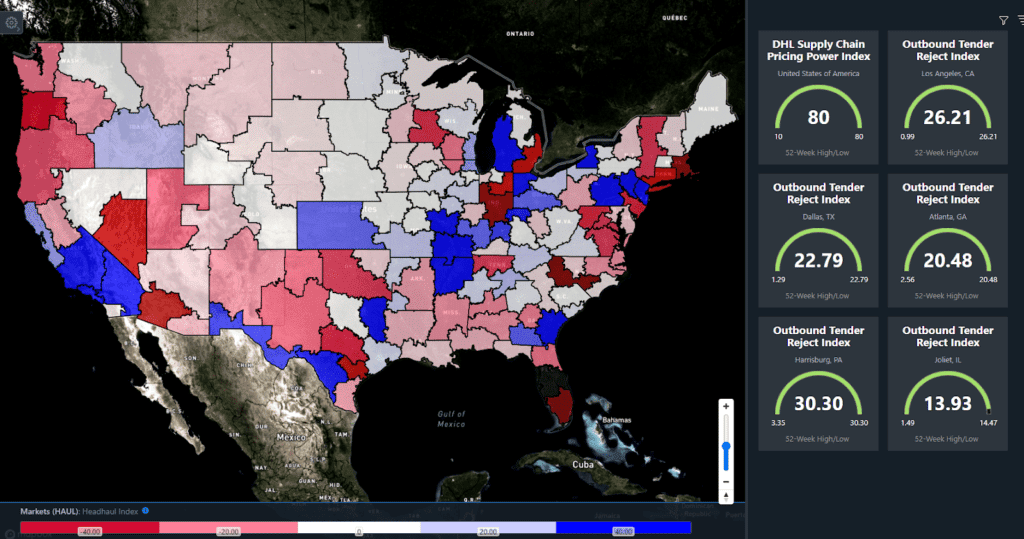
SONAR Indexes Show Tight Trucking Capacity
What Shippers need to do
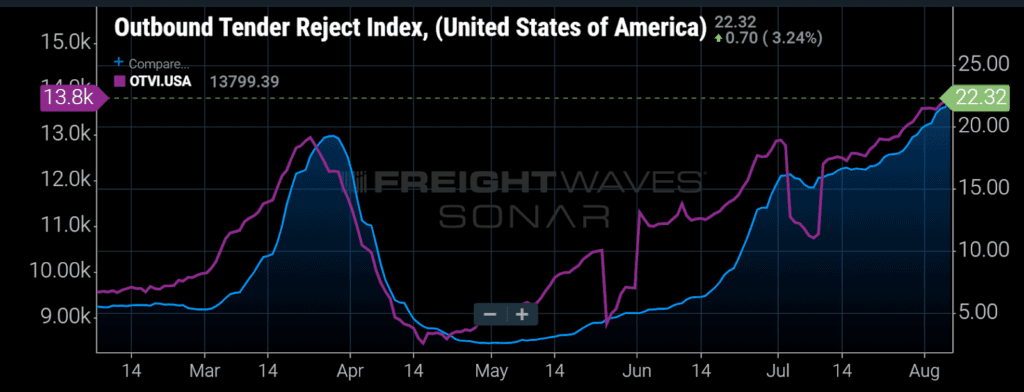
Capacity remains tight for shippers in most markets across the nation, pushing tender rejection rates a little higher each day. The DHL Supply Chain Pricing Power Index is at an all-time high of 80, increasing the strength that carriers hold over shippers in rate negotiations for on-demand capacity in the spot market. Markets in Southern California, the Midwest and Northeast are seeing heavier outbound volumes over inbound volumes, tightening capacity in the entire region, and pushing spot rates well above the average for this time of year. Rejection rates have hit 52-week highs in several key distribution markets such as Los Angeles, Dallas, Atlanta and Harrisburg.
Shippers will need to continue to book their freight as far in advance as possible, and pressure their contracted carriers to accept their freight. It is evident from the data that shippers need to focus on retaining or gaining “Shipper of Choice” status. On-demand capacity will be expensive for same-day shipments, and as rejection rates continue to rise, shippers will be forced to pay the higher rates carriers are demanding to get their freight moved.