Each week, you’ll learn about another index found within SONAR, the freight forecasting platform from FreightWaves. This week the Customs Maritime Import Shipments (CSTM) is highlighted. This index allows SONAR subscribers to view leading indicators of domestic trucking activity in the near future, and plan for trucking capacity and freight rates. Read further to learn what the CSTM is and how knowing the incoming volume of ocean imports will provide a more proactive approach to freight management.
What is the Customs Maritime Import Shipments (CSTM) Index?
The CSTM displays data related to import ocean shipments into the U.S. as reported by U.S. Customs and Border Protection (USCBP). This is the total number of import ocean shipments and includes both containerized and non-containerized goods.
This is available in the following time frames:
Daily – 7-day moving average (CSTM)
Weekly (WCSTM)
Monthly (MCSTM)
How CSTM allows participants to see ocean imports data and gain deeper trucking insights
Using this data, a SONAR subscriber is able to understand how U.S. import volumes are trending before they are officially reported by each port authority in their monthly summaries of volume statistics; these usually come out around the 15th of the following month without SONAR.
View U.S. import ocean shipments per country of origin (i.e. China to U.S. – CSTM.CHNUSA), on a lane level (LCSTM), or a U.S. port-specific level (ICSTM). This enables you to monitor how U.S. importers are responding to global trends in international trade, and how that is likely to affect the domestic truckload and intermodal markets here in the U.S.
How would various freight participants use the CSTM Index?
When freight participants in the market understand the CSTM, they can understand demand, plan for capacity shortages or boons, and get a better leading indicator of trucking rates moving from those markets where these major ports are located. Let’s take a look at how various freight market participants use CSTM to monitor ocean imports volumes and plan accordingly:
Analysts: The volume of ocean imports clearing U.S. customs is a leading indicator of intermodal and truckload demand since imports require subsequent surface transportation to warehousing or consumption centers. Imports are closely tied to the railroads’ international intermodal volumes. In addition, a large portion of the goods moved by publicly traded domestic intermodal providers includes imported freight that has been trans-loaded from international containers into larger domestic containers. The market share of U.S. ports of entry should be monitored by analysts because intermodal is a much more viable service for imports entering via the West Coast (i.e., more competitive with trucks) given the longer average lengths of haul to consumption centers.
Carriers: Since the U.S. imports much more than it exports, and a large percentage of those containerized international shipments eventually transition into truckload volumes, keeping track of the CSTM tickers can provide insights into which ports in the U.S. are handling those international volumes. Many of these volumes are brought into U.S. ports and then moved to nearby distribution markets for transloading into truckloads, so these markets are important to monitor for volume trends.
Brokers: Brokers are the intermediaries between carriers and shippers and are dependent upon the same volumes that are brought into the U.S. from overseas. Much like carriers, monitoring the CSTM tickers can provide important insights into different markets/regions within the U.S. for truckload volumes.
Shippers: By monitoring the CSTM tickers, shippers can gain insights into which countries of origin other importers are sourcing their materials from. Shippers can also monitor important trends in U.S. port volumes to better understand how increasing or decreasing ocean imports demand through specific ports may affect their supply chains.
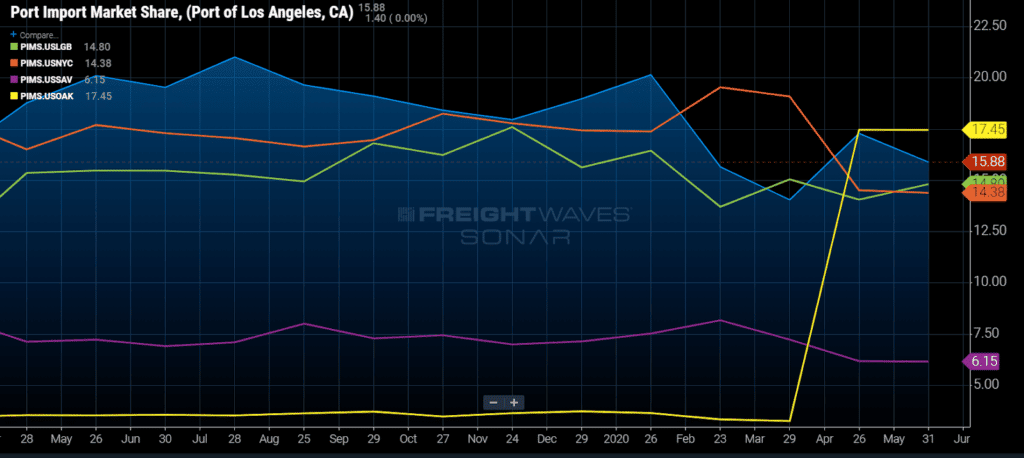
How to use the CSTM Index with other SONAR charts
Use CSTM with Port Import Market Share (PIMS) to see the market share of one particular U.S. port relative to all other U.S. ports. The Port Import Market Share (PIMS) displays the market share that each U.S. port is capturing of the total U.S. Customs Maritime Import Shipments on a monthly basis. The U.S. ports labeled in this ticker are the U.S. ports that were identified as the ports of entry on the bill of lading when the shipments were cleared for entry by USCBP. There is only one port of entry for each shipment.
PIMS tells you how many shipments are being cleared through each port by USCBP. In other words, of all ocean imports shipments that are being cleared through U.S. ports each month, what percentage is moving through a specific port of entry. PIMS shows you the clear shifts in volume each month between all U.S. ports of entry. This can be important when trying to distinguish how U.S. importers are choosing to route their shipments and can be a lead indicator for which parts of the country are receiving more import shipment volumes. Consequently, you can determine which are likely to create more outbound truckload and intermodal volumes.
A real-world example of using CTMS with other SONAR indices to understand the ocean rate outlook
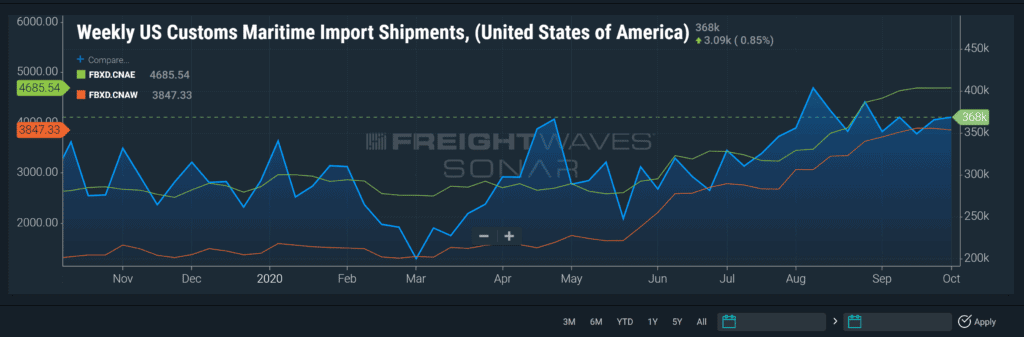
Here is an example of using the CTMS in combination with the Freightos Baltic Daily Index (FBXD) (screenshot image below) to plan for future rates for the next month as explained by FreightWaves’ Market Expert, Henry Byers in “Daily Watch:”
“As Golden Week in China winds down and workers come back online, U.S. ocean imports demand remains elevated on a year-over-year basis. Ocean carriers are still claiming that their vessels will continue to be mostly full for the rest of October with minimal blank sailings, and that forecast is certainly confirmed via FreightWaves SONAR ocean bookings data that shows that bookings for the next 7 days are indeed elevated on nearly every major import lane.
“Despite the year-over-year increase in demand, ocean rates appear to have reached their peak, so rates should remain relatively stable for the remainder of October and decline slightly from there through the end of the year. Currently, the average rate for a 40-foot container (per FEU) from China to North America West Coast is down about $40 week-over-week to $3,840 per FEU. As for China to North American East Coast container rates, they are down around $10 per FEU week-over-week, and currently sit at $4,677 per FEU.”
Keep ahead of the freight market and turn to SONAR to track ocean imports and plan proactively
In uncertain times, freight market participants need certainty to stay ahead of the freight market and understand the freight demand occurring in each participant’s most important lanes. The freight forecasting engine, FreightWaves SONAR, allows participants to benchmark, analyze, monitor and forecast freight demand and costs to ensure more proactive responses to the market, the ability to provide a solid customer experience by offering transparency and make faster, more informed decisions. Get a demo of SONAR to see what the platform can do for you.