

Being a non-asset brokerage has its perks. Your sales team has the freedom to call any customer under the sun. Your carrier sales team is able to provide back up capacity instantly. Your liability is limited and risk are mitigated to the operations within your walls.
So why get assets?
Anyone that has made sales calls at a non-asset brokerage has heard this response daily:
“DO YOU HAVE TRUCKS?”
And sometimes followed by:
“NOT SOMEONE ELSE’S TRUCKS, YOUR TRUCKS?”
If the sales rep doesn’t get hung up on after saying no, their experience will allow them to explain the importance of a brokerage being able to leverage carrier assets, bring more supply to shippers, along with cost savings.
As small, non-asset brokers begin to grow, there is a tipping point where your contracted lane volume gives you a chance to consider the thought:
“Should we buy a truck?”
It is important to understand the risks of running a trucking company and to research the best way for your company to incorporate equipment into your business model.
In this SONAR example, I want to focus on the decision of when to start a trucking company and more importantly, what type of equipment would be best to use.
The SONAR Operating Ratio index (OPRAT) provides the total operating costs divided by the operating revenue. It measures how every dollar received from customers is spent on expenses including driver wages, truck lease, insurance, and maintenance. This is sourced monthly from members belonging to the Truckload Carriers Association, analyzing $38 billion of annual revenue.
The OPRAT is divided into the following granularities:
The unit in this index represents the percent value of the costs. If your OPRAT index value is 100, that means every dollar you spend, makes you a dollar back with no profit.
A brokerage that is considering buying assets can use the OPRAT brokerage division indexes to examine how the market is favoring these companies.
When the index value increases, carriers’ profit margins are tightening, making it hard to maintain a profit. When the value decreases, the carriers are increasing profit from freight rates elevating.
If the value is over 100, the rates they are receiving are so poor that it is costing the carrier to pick up a load, leading to carriers staying home until market conditions turn in their favor.
A brokerage would want to avoid buying assets in a market where this index is increasing to or above 100, as these conditions tend to accelerate poorly-managed trucking companies into bankruptcy. As conditions begin to turn back down, liquidated assets from carriers trying to maintain profit have become inexpensive, justifying the investment.
In the SONAR chart below, we can examine this market scenario, which occurred prior to pandemic fears. This compares the operating ratios of flatbed (OPRAT.FCNS), reefer (OPRAT.RCNS) and van trucking companies (OPRAT.VCNS).
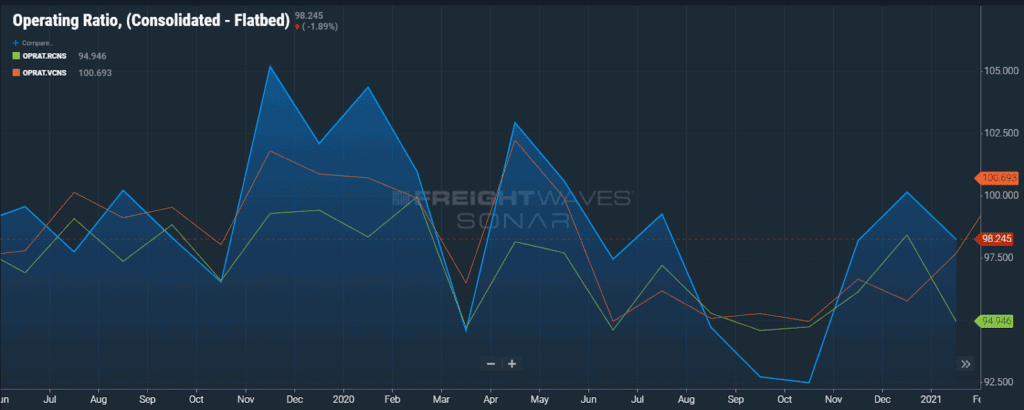
SONAR: OPRAT.FCNS (OPRAT.RCNS – Green; OPRAT.VCNS – Orange)
The first spike in all three ratios show the effects of what many called a trucking “bloodbath”, where transactional carriers felt the softened freight market hit the spot market rates as tariffs and trade regulation affected imported goods. The industry saw trucking bankruptcies triple, including industry leaders like New England Motor Freight, Celadon, and Falcon Transport.
The flatbed market saw an exceptional increase in October 2019, as winter conditions and anticipation of the Dec 15 tariff deadline pushed flatbed freight volumes and rates to extraordinary lows. The OPRAT.FCNS hit 105, making it difficult for a flatbed carrier to consider moving a load. We saw some downturn for oil field development but was quickly brought back up as we waited for raw material imports to come in from China.
This would have been the most opportune time to buy flatbed trailers. As large volumes of open deck trailers became available for purchase through liquidation, prices became so low that carriers could return their investment on the assets within a few months.
Then a dramatic decrease occurs across all trailer types.
The pandemic began to hit U.S. soil, shutdowns nationwide instantly stopped freight from moving and shippers dropped rates in order to preserve cash flow for an undefined period of time. Food became most essential, and reefer carriers were able to continue making profit.
As shutdowns ended, and imports began to come in from China, a massive dip occurred across all trailer types. This positioned companies looking to buy assets to take advantage of lower trailer prices, as many were sold to keep cash flow positive during pandemic uncertainty.
Non-asset brokers who are seeing carrier rates increase should now consider the following SONAR chart.
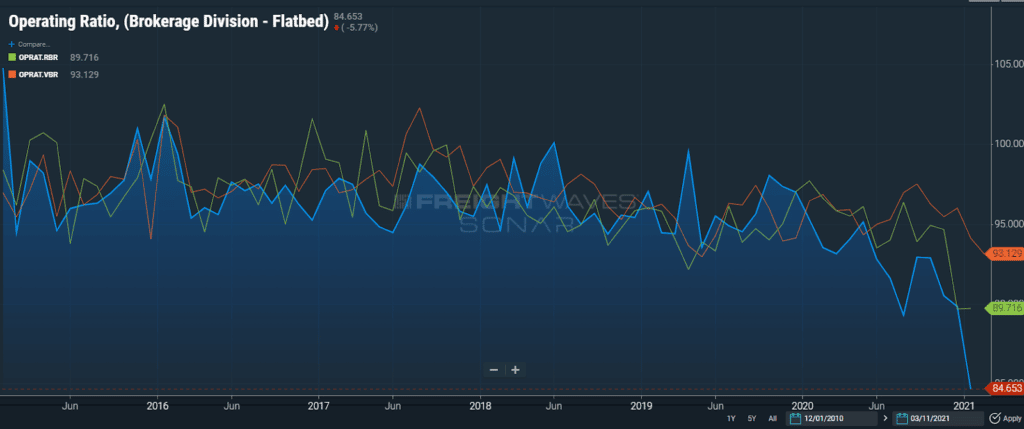
SONAR: OPRAT.FBR(OPRAT.RBR – Green; OPRAT.VBR – Orange)
This chart shows the operating ratio trends for asset-based brokerages back to early 2016. Notice very little movement, with most operating around 95. This means that historically, these brokerages operate with very low margins. It is important to note that these ratios do not include debt, something that is usually acquired when buying trucks and trailers. The dip in operating cost that is seen recently is related to pandemic recovery volumes bringing spot rates up 25% since February.
Asset-based companies have high operating ratios, with averages coming in closer to 89 percent. In 2017, when truckers left the market due to ELD regulations, their average profit margin increased to 6 percent, which traditionally sits around 3 percent. This is why you see an increase in autonomous and electric vehicles investment, because it is not easy to make money considering the fixed expenses that come with assets.
Last year the average margin for a non-asset brokerage was about 15%.
Carriers will not be selling anytime soon, as shipment volumes will continue to stay high. The driver shortage is pushing driver salaries up, making it even more difficult for a non-asset broker to enter the market without operating at a loss to attract good drivers.
Buying assets will take more consideration as the investment of trailers will continue to rise. If you are adamant on investing in trailers, your best bet is to lease trailers when your company predicts low capacity in areas where you have dense freight. That leverage can still be achieved through proper carrier procurement. Integrating your company’s freight data with our SONAR API would allow you to examine these opportunities.
Until then, your best bet is to follow the lead of legacy trucking companies: invest in technology to increase your margin.
There are only two ways to bring those rates down, flood the market with qualified drivers or hope for an economic downturn.
The former is close to impossible with current driver training school bottlenecks. The latter could cause a favorable flood of liquidated trucks, but sustainability initiatives may render those trucks worthless.
FreightWaves SONAR provides the fastest freight market data in the world across all major modes of traffic. SONAR can guide those seeking to be a successful freight broker or can be used in executing these charts in SONAR to build a stronger freight broker book of business. The SONAR platform is the only freight forecasting and analytics platform that offers real-time freight market intelligence-driven off actual freight contract tenders.
SONAR contains proprietary data that comes from actual load tenders, electronic logging devices and transportation management systems, along with dozens of third-party global freight and logistics-related index providers like TCA Benchmarking, Freightos, ACT, Drewry and DTN.
Whether you’re working from the office or from home, SONAR can provide you the data and intelligence you need to stay ahead of your competitors.
Find out more about FreightWaves SONAR for brokers.


