

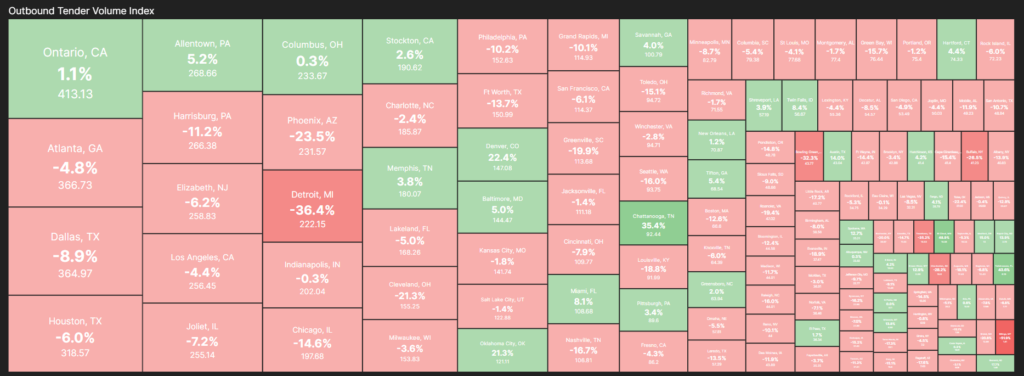
In today’s complex freight industry, comprehending regional market nuances is essential for logistics professionals looking to navigate the intricacies of supply chain management. Key market areas (KMAs) serve as critical geographical segments, delineated by 3-digit ZIP code areas. With 135 such entities spread across the United States, KMAs offer microcosms of freight market behavior, influenced by factors such as population density and economic activity. Within each KMA, freight landscapes can vary from bustling hubs to quieter regions, collectively providing a comprehensive view of market dynamics. Recognizing the collective significance of market conditions across KMAs at any given time, logistics professionals can devise strategies that accommodate the diverse nature of these areas, ensuring efficient and effective freight procurement and management.
To grasp broader market momentum and anticipate potential market turns, logistics professionals can aggregate the individual indicators of the 135 KMAs. For instance, by tracking outbound tender volumes and rejections across each KMA, logistics experts can gauge fluctuations in supply and demand across the entire market. This aggregated approach allows for a holistic understanding of market dynamics, enabling professionals to anticipate broader market disruptions and proactively adjust capacity allocation. By synthesizing data from multiple KMAs, logistics professionals can effectively discern patterns and trends on a larger scale, facilitating informed decision-making and enhancing overall supply chain resilience.
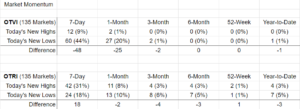
As an example of how logistics professionals may track broader market momentum, we can leverage the concept of market breadth by monitoring the number of new highs and new lows across all 135 KMAs over various timeframes for both outbound tender volumes and rejections. Analyzing the frequency of new highs (indicating increasing market activity) and new lows (indicating decreasing market activity) across all KMAs provides valuable insights into market momentum. For instance, a higher number of new highs compared to new lows over multiple timeframes for outbound tender volumes suggests a bullish market sentiment and growing demand, indicating positive market momentum. Conversely, a higher number of new lows may signal a bearish market sentiment and declining demand, indicating negative market momentum. This holistic approach empowers professionals to stay ahead of market trends, mitigate risk and optimize operational efficiency within the ever-evolving landscape of the freight industry.
Curious about how KMA trends can inform an effective supply chain strategy? Reach out to our team to learn more.


