The Lane Scorecard app is a key enhancement of the launch of FreightWaves SONAR 7.0. “What makes Lane Scorecard unique from bulk lane rate tools on the market is its proprietary SONAR lane scoring, SONAR predictive rates and its spark graphs that allow the user to more easily see past and forecast trends,” announced Craig Fuller, FreightWaves founder and CEO.
“With Lane Scorecard, SONAR subscribers will save time because Lane Scorecard is organized and in the ‘right’ spot, will receive near-time market intelligence to improve pre-RFP strategy analysis and can identify new market opportunities with little to none native, historical data,” Fuller explained. Lane Scorecard is available to SONAR subscribers for an additional fee.
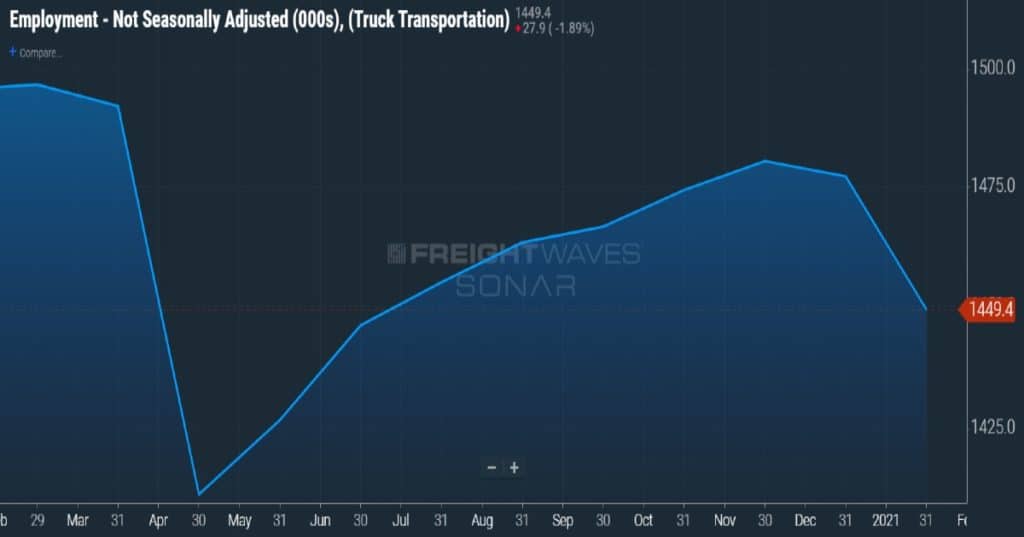
“Lane Scorecard is an app that is launched from SONAR’s main navigation panel,” Fuller added. “It can be enabled/permissioned at the organization or user level. For Lane Scorecard’s initial release we plan to show FreightWaves predictive rates – both forecast and historical.”
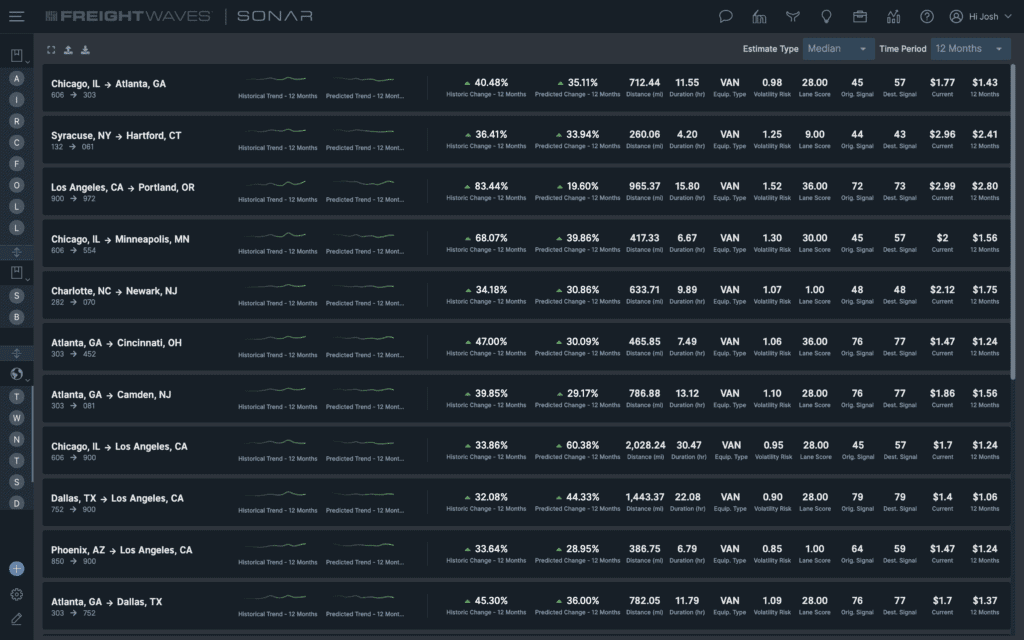
Lane Scorecard was developed in conjunction with SONAR clients and from client feedback. It will allow users to bulk upload lanes and get the following for each lane:
- Historical % change (spark chart)
- Predicted % change (spark chart)
- Distance (miles)
- Duration (hours)
- Equipment type (not yet available for reefer)
- Volatility risk score
- Lane score
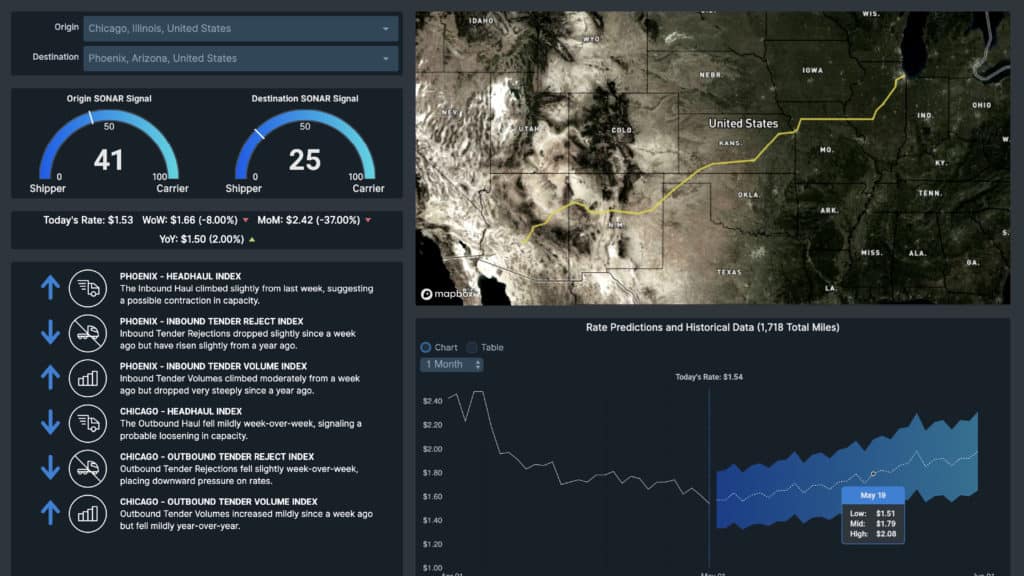
- Origin SONAR Signal
- Destination SONAR Signal
- Current rate
- Predicted rate
Users will be able to select a time period for predictive rates from the drop down, and whether or not they want to see high, median or low rates. Before users upload anything, Lane Scorecard will default to the top 20 Truckstop.com lanes.
Users will upload a comma-separated values (CSV) file with the origin/destination pair zip codes (zip 5 or zip 3). There will be a template they can download on the upload window. Users will be able to upload 200 lanes at a time (to be expanded in the future). In addition, users will be able to download the results from Lane Scorecard to a CSV and open it in Excel.
In regard to Lane Scorecard’s use with RFPs, it can identify and assign appropriate ‘risk premiums’ on traditionally volatile lanes. With Lane Scorecard, a user can create ‘ideal potential bid packages’ to leverage during mid-RFP round negotiations. In post-RFP execution planning, a user can report/benchmark the overall ‘attractiveness’ of a final award before signing off on an annual commitment. And, a user can appropriately allocate internal resources to secure dedicated capacity, based on a Lane Scorecard lane profile.
With the SONAR user interface, users can see lanes, market intelligence and rates. As a user interacts with the results table he/she can easily see the visualizations that provide additional insight that only SONAR does best.
Lane Scorecard data can be returned via API for flexible integration into a client’s transportation management system platform.