


At its core, freight volume data gives shippers the information they need to gauge raw market demand. These insights give companies a look into current market dynamics, allowing them to predict capacity changes and anticipate market shifts. This is critical for companies aiming to be responsive instead of reactive in a volatile market.
FreightWaves SONAR gives logistics leaders access to the near-time volume insights they need to make proactive business decisions, regardless of how the market changes. In fact, the Inbound Tender Volume Index (ITVI) and the Outbound Tender Volume Index (OTVI) are two of the data platform’s most popular — and most illuminating — indices.
OTVI tracks electronic offers from shippers to truckload carriers. ITVI, on the other hand, measures electronically tendered volumes based on destination markets across the country. Both data sets can be visualized on either a nationwide or market-specific basis.
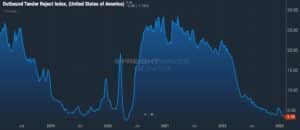
Other SONAR indices — including the Inbound Tender Rejection Index and the Outbound Tender Rejection Index — can be combined with the volume indices to illustrate exactly what is happening in the freight market. These insights, taken together, paint a full picture of the push and pull within the market. Understanding these dynamics is important because freight pricing is determined by supply and demand.
Currently, tender rejections have reached a multiyear low. This informs shippers that carriers are having a hard time keeping their trucks loaded, indicating plentiful capacity and falling rates. If tender rejection rates were to begin rising, this would show shippers that capacity is tightening and rates are likely to creep upward.
Understanding volume data, however, is not only useful for navigating the transportation world. The freight markets are known as a reliable proxy for the “Main Street economy,” which represents conditions for small businesses and average citizens.
The freight markets go hand in hand with the “goods” portion of the economy, and understanding transportation trends means understanding economic trends. This is because companies naturally move more items when demand is stronger and fewer items when demand is weaker. Taking this into account, today’s freight market shows a steady decline in demand across the goods economy as consumers hunker down for a potential recession.
Using freight data to gauge the state of the overall goods economy gives logistics leaders an early look into major economic trends, allowing them extra time to adjust their production and operational efforts to align with upcoming consumer spending changes. This saves shippers money, cuts down on waste and, in the most extreme circumstances, protects companies from going under during economic downturns.
Schedule a free consultation to see how SONAR can reduce your costs and performance risks.


