

Operating a successful freight brokerage means offering competitive freight rates to shippers, working with more carriers, and keeping employees happy. And few topics are better suited for employee retention than a competitive, lucrative salary. However, the trucking market continues to change and plays a role in setting standards for brokerage salaries. According to Indeed.com, brokers make an average of $62,105 per year. And that is before adding on another $28,000 per year for commissions. Regardless of the national average, fluctuations exist to reflect more competitive markets and those where a brokerage can add the most value. To that end, consider these freight broker salary ranges and how they respond to the market.
Brokerage clerk salary ranges
As the economy recovers going into 2021, freight broker salary ranges are likely to increase in kind. But before delving into the salary, consider the percentage that brokerage clerks comprise within the transportation and management sectors. As reported by the U.S. Bureau of Labor Statistics (BLS), occupational brokerage clerks are 0.09% of employees within the freight transportation arrangement sector. And brokerage clerks are 0.07% of employees within the management of companies and enterprises.
Brokerage clerks within the freight transportation arrangement sector make an annual mean wage of $51,560. However, the BLS only sets the annual mean wage at the 50th percentile. For example, the following BLS map shows the annual mean wages by state:
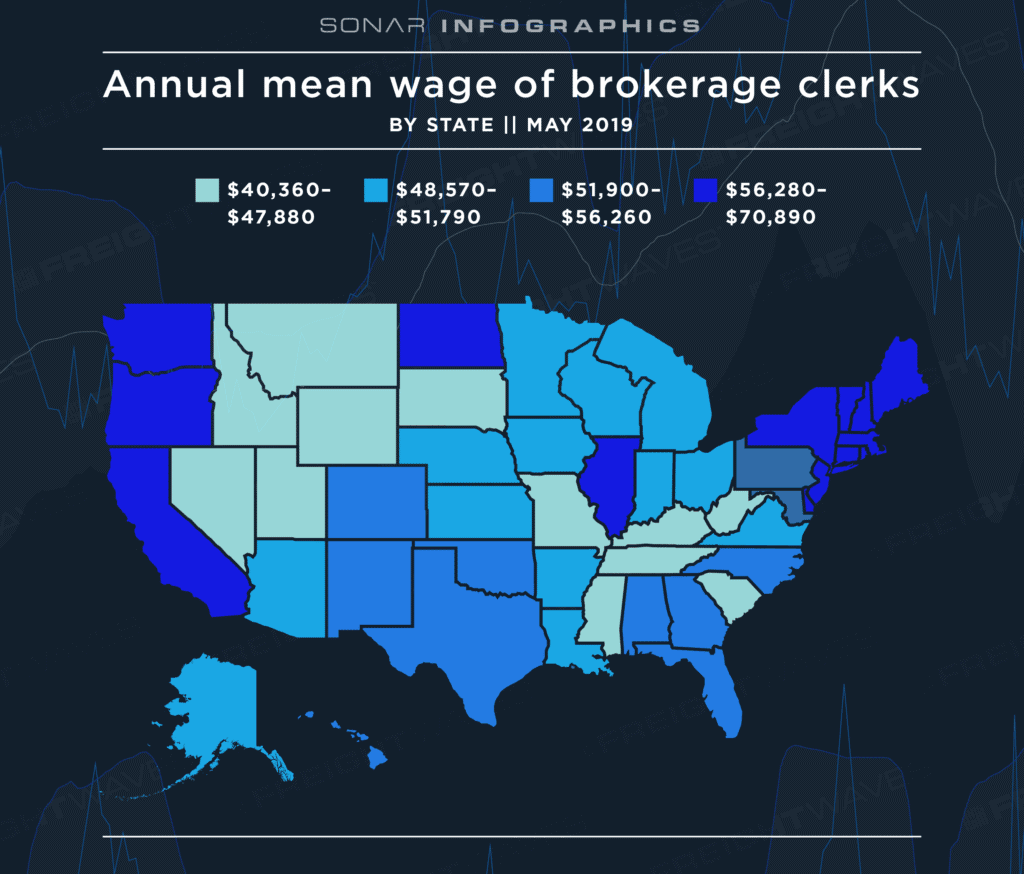
For example, brokerage clerks in New York have an annual mean wage of $70,890. But that’s still below the annual wage of those in the 90th percentile. Specifically, the national annual wage for brokerage clerks is $78,160 in the 90th percentile.
What about density and salaries of brokerage employees by regions
While looking at national averages is instructive, there are whole swaths of the country where a brokerage may not necessarily be necessary. Most importantly, brokerages tend to be concentrated along major waterways, air and seaports, and other industrialized areas. According to the BLS, the location quotient, showing the density of brokerage workers, reveals this trend:
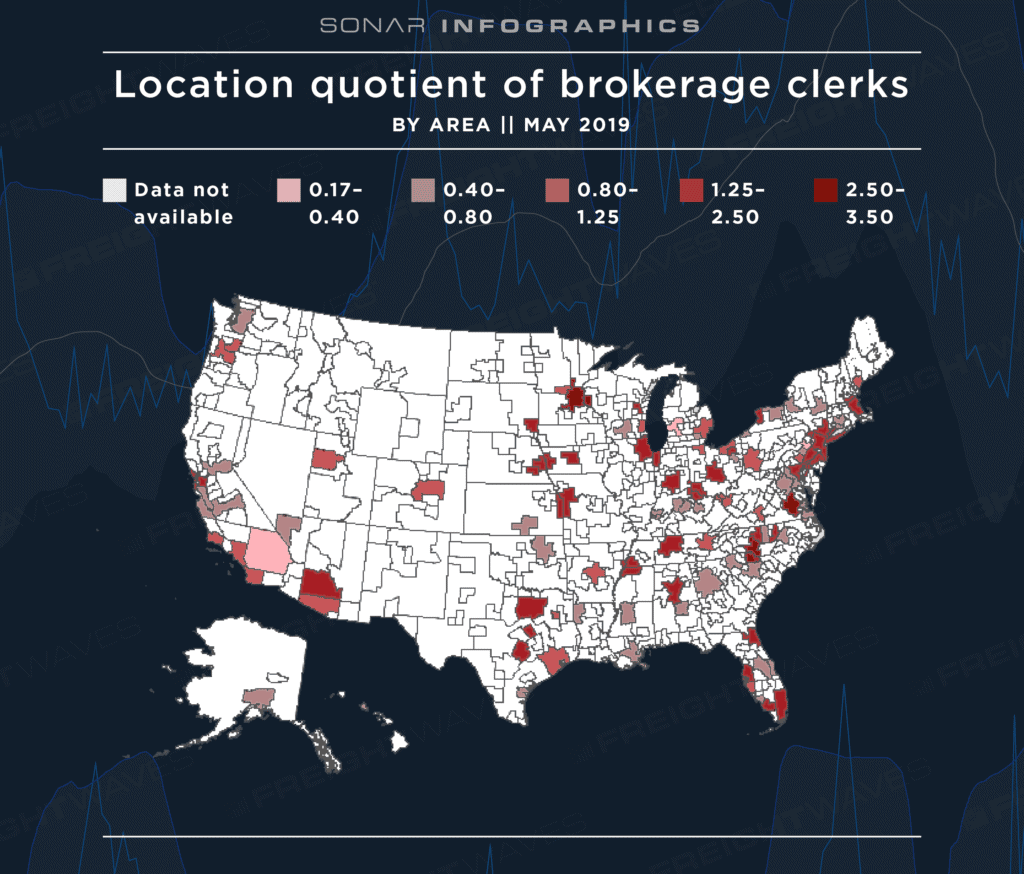
Now, let’s dig deeper. Looking at that map shows the density of brokerages ranging from 0.17 to 3.5. And it stands to reason that areas with a larger density would represent a higher density of workers, more freight market activity, and the need to offer better salaries or hourly wages.
For instance, consider the top-paying metropolitan areas for brokerage clerks and their annual mean wages, shown in this chart:
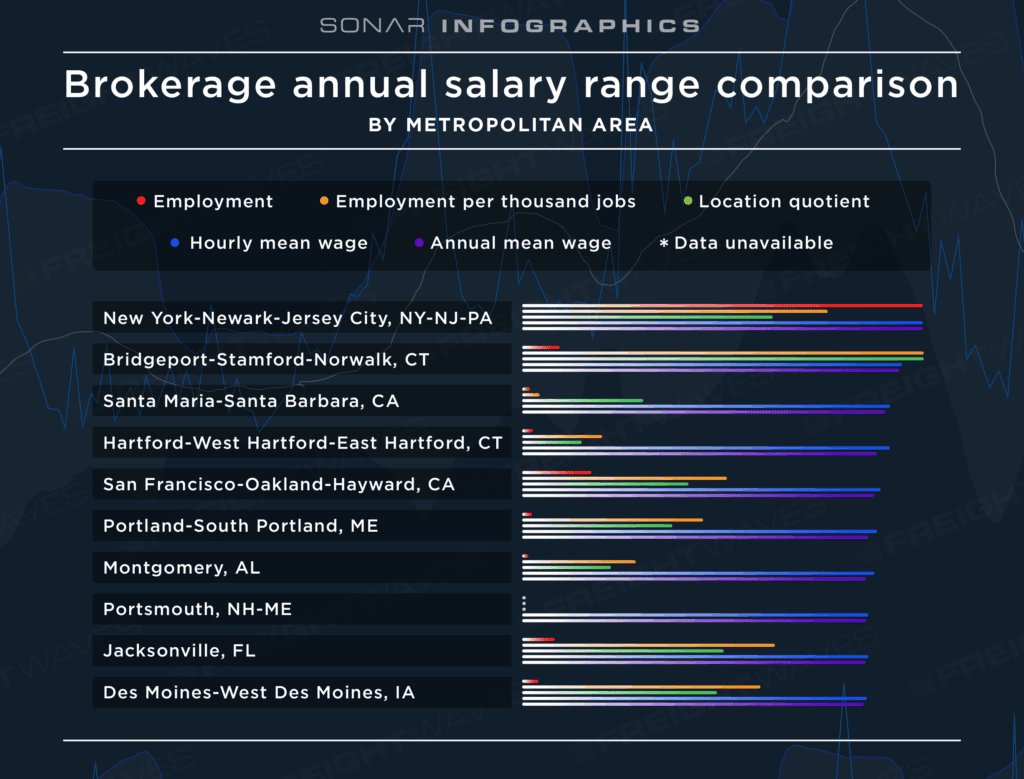
For each area, the top-paying metropolitan area average may decrease from the New York statewide average. However, this data is so specific that it still represents the 70th percentile of the national average. So, it would be reasonable to assume that the rates listed above indicate what talent makes in the areas. That is for a simple reason. The data collected by the BLS follows the whole industry, and workers in specific metropolitan areas are more likely to have additional experience and skills that can add value. So, the total brokerage salaries for the busiest of sites will inevitably be higher than others.
Here is another view of metropolitan-based annual wages at the 50th percentile across the country from the BLS:
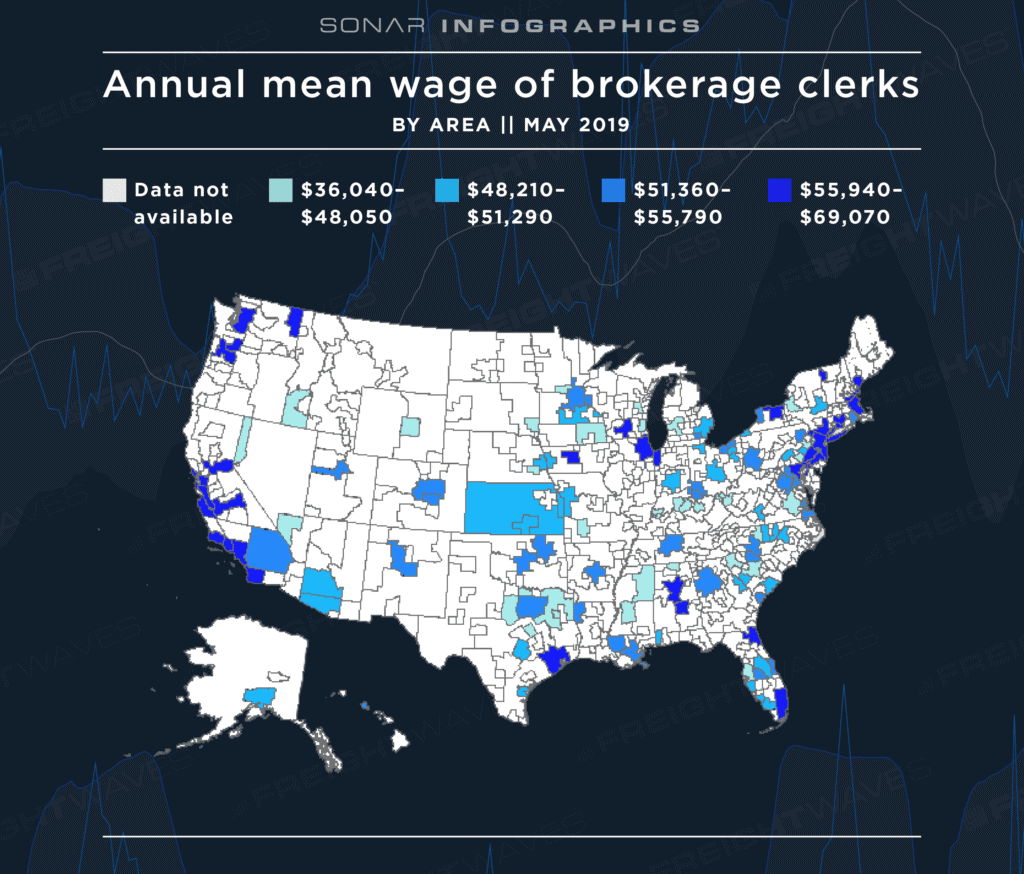
That means that some areas – even those where rates are higher than $69,000 – are going to still be at the 50th percentile. So 90th percentile rates in the darkest blue areas could be more than $100,000.
Why freight broker salary ranges matter to brokerage management
That’s a loaded question. Broker salary ranges matter because that’s how a company retains its workers. However, it also means that brokerages need to ensure their workers are getting and booking the most lucrative loads. To that end, they need to trust their employees to leverage data and make informed decisions on which loads and business relationships, i.e., carriers, will be the most profitable.
FreightWaves SONAR can help achieve those goals by highlighting:
- The markets with the greatest demand for brokerages, such as those where carriers have a stronger negotiating power, are represented by a higher Lane Signal.
- The local areas, including those near ocean ports, that are driving increased drayage activity and higher rates.
- The overall rate of tender rejections, alluding to the need to work with more carriers to find lower rates and more competitive business partnerships.
- Ways to improve strategic brokerage positioning – particularly the ability to reallocate assets to markets where demand is rising, which would trigger a rise in overtime for hourly workers and higher overhead.
Get the data your brokerage needs to build the most lucrative processes and enable your team with more profitable back-office management through SONAR
Freight brokerages are businesses that carry both shipper-like and carrier-like qualities, depending on whether they are asset-based or not. With that in mind, it’s imperative to realize that brokerages, despite the advances in transportation optimization, are likely to have the thinnest profit margins of all transportation management segments. And having access to real-time data that empowers brokerage workers to get the most profitable and lucrative loads first and fastest is essential to overall success. Fortunately, SONAR provides just that. Request a SONAR demo online to get started.


