

Whoa…what a title, right? But let’s not overcomplicate things: having the right data beats having a lot of data. (It helps that we have both, but we’ll save that for another blog). In this fast-paced, competitive world, it is critical to leverage data to make informed decisions quickly. For a broker, this means understanding when to bid aggressively vs. less so in comparison to other lanes and the market. For a shipper, this means identifying areas of risk (either with overspending or service levels).
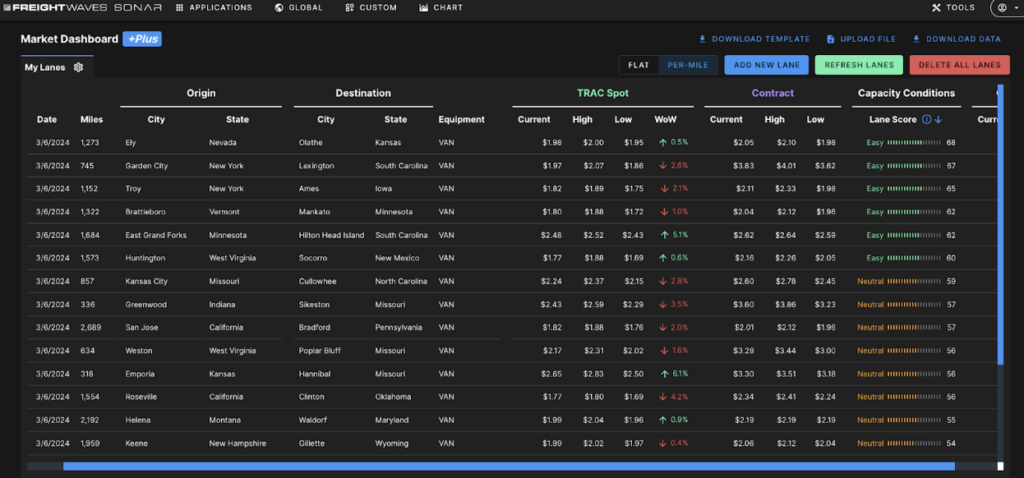
Insert lane scores — comparative corridor rating against the rest of the lanes at any given time. On the most fundamental level, Lane Scores measure how “head haul” or “back haul” a given lane is in comparison to the market. In a soft market like the current one, there are still easier and harder lanes to manage. And we watch this happen in real time as purchasing decisions, seasonality, weather and macroeconomic impacts create ebbs and flows across our wonderful domestic supply chain.
It’s 2024, and if your company is not already using a rate provider… you’re way behind. Let’s assume everyone is. If freight pricing and management were a casino card game, rates would be table stakes. This is where SONAR lane scores are different from other players. SONAR works upstream with industry-leading technology players to understand volume and rejection data at the point of freight tender (shipper to carrier). Much of this data comes before the freight is even picked up. Compare this to load posting vs. truck posting data on a load board, and you’re several steps down the waterfall of freight and late to the game. It’s like having Rainman give you odds for every hand while you’re sitting at the blackjack table…no delays or errors in insights.
There are many schools of thought around how to most effectively price freight. Every broker and shipper we talk to has their own secret sauce. What is undisputed amongst these players is that having the right data in the right places for the right people to make the right decisions is the right path to a successful transportation operation. So if you’re not considering SONAR Lane Scores, you might be mis-pricing that load, bid or contract relationship.
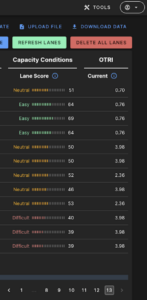
Use the Lane Score to your advantage: it’s easy to remember and even color-coded in SONAR UI.
0–25 = Most Difficult to Cover
26–40 = Difficult to Cover
41–59 = Neutral
60–75 = Easy to Cover
76–100 = Easiest to Cover
Think of it like your confidence in whether to be aggressive or not (like asking for another card in our fun blackjack example). A score of 90 tells you that you can be aggressive, confident that you’ll be able to cover more easily than most other lanes. But a score of 5 should bring extreme caution.
Are you ready to add Lane Scores to the toolbelt for your most important logistics talent? Chat with us today at [email protected].


