There are many different ways that full truckload rates are priced. Freight forecasters need to understand the similarities and differences for each to accurately predict transportation rates across dry van, refrigerated, flatbed, and bulk loads.
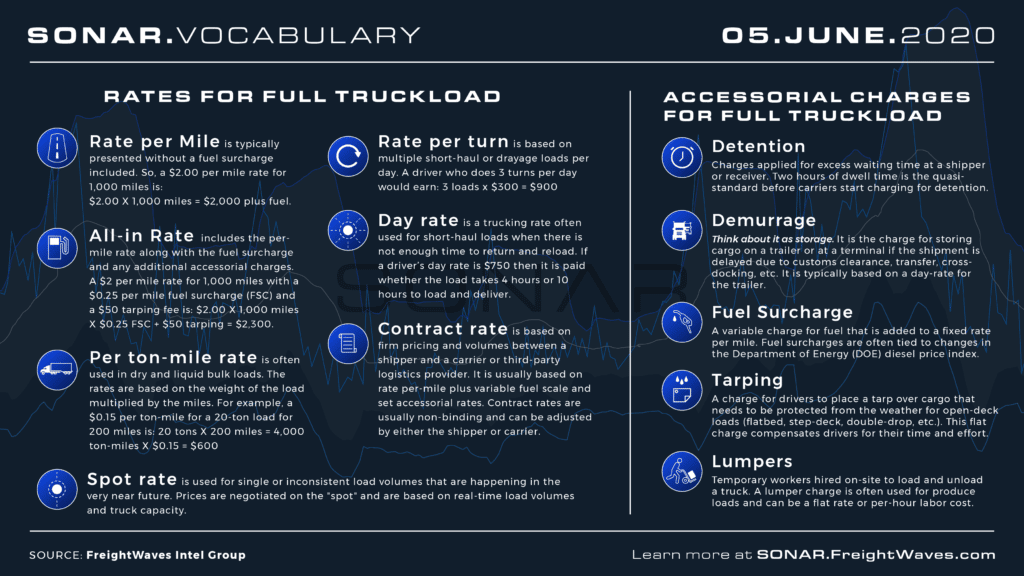
Rates for full truckload
Rate per mile is typically presented without a fuel surcharge included. So, a $2.00 per mile rate for 1,000 miles is: $2.00 X 1,000 miles = $2,000 plus fuel.
All-in rate includes the per-mile rate along with the fuel surcharge and any additional accessorial charges. A $2 per mile rate for 1,000 miles with a $0.25 per mile fuel surcharge (FSC) and a $50 tarping fee is: $2.00 X 1,000 miles X $0.25 FSC + $50 tarping = $2,300.
Per ton-mile rate is often used in dry and liquid bulk loads. The rates are based on the weight of the load multiplied by the miles. For example, a $0.15 per ton-mile for a 20-ton load for 200 miles is: 20 tons X 200 miles = 4,000 ton-miles X $0.15 = $600
Rate per turn is based on multiple short-haul or drayage loads per day. A driver who does 3 turns per day would earn: 3 loads x $300 = $900
Day rate is a trucking rate often used for short-haul loads when there is not enough time to return and reload. If a driver’s day rate is $750 then it is paid whether the load takes 4 hours or 10 hours to load and deliver.
Contract rate is based on firm pricing and volumes between a shipper and a carrier or third-party logistics provider. It is usually based on rate per-mile plus variable fuel scale and set accessorial rates. Contract rates are usually non-binding and can be adjusted by either the shipper or carrier.
Spot rate is used for single or inconsistent load volumes that are happening in the very near future. Prices are negotiated on the “spot” and are based on real-time load volumes and truck capacity.
Accessorial charges for full truckload
Detention – Charges applied for excess waiting time at a shipper or receiver. Two hours of dwell time is the quasi-standard before carriers start charging for detention.
Demurrage – Think about it as storage. It is the charge for storing cargo on a trailer or at a terminal if the shipment is delayed due to customs clearance, transfer, cross-docking, etc. It is typically based on a day-rate for the trailer.
Fuel Surcharge is the variable charge for fuel that is added to a fixed rate per mile. Fuel surcharges are often tied to changes in the Department of Energy (DOE) diesel price index.
Tarping is the charge for drivers to place a tarp over cargo that needs to be protected from the weather for open-deck loads (flatbed, step-deck, double-drop, etc.). It is a flat charge that compensates drivers for their time and effort.
Lumpers are temporary workers hired on-site to load and unload a truck. A lumper charge is often used for produce loads and can be a flat rate or per-hour labor cost.
See what trucking companies can do to maximize trucking rates. If you are interested in tracking the freight market, including contract and spot rates, FreightWaves SONAR offers over 150,000 indices, most of which are updated daily. The world’s fastest, most accurate freight data includes trucking spot rate indices, tender indices, and market balance indices. SONAR freight tender indices are created based on actual electronic load requests from shippers to carriers, meaning you know that the index is measuring an actual load transaction.
SONAR offers proprietary data that comes from actual load tenders, electronic logging devices and transportation management systems, along with dozens of third-party global freight and logistics-related index providers like TCA Benchmarking, Freightos, ACT, Drewry and DTN.
SONAR offers the fastest freight market data in the world, across all major modes of traffic. The SONAR platform is the only freight forecasting and analytics platform that offers real-time freight market intelligence driven off actual freight contract tenders. Find out more about FreightWaves SONAR.