Faced with anemic demand growth and persistent margin pressure, CPG, retail, and food and beverage companies are being forced to make their transportation networks and supply chains more nimble in the face of recession. That’s where point of sale freight data comes in to help supply chain leaders create a superior supply chain strategy.
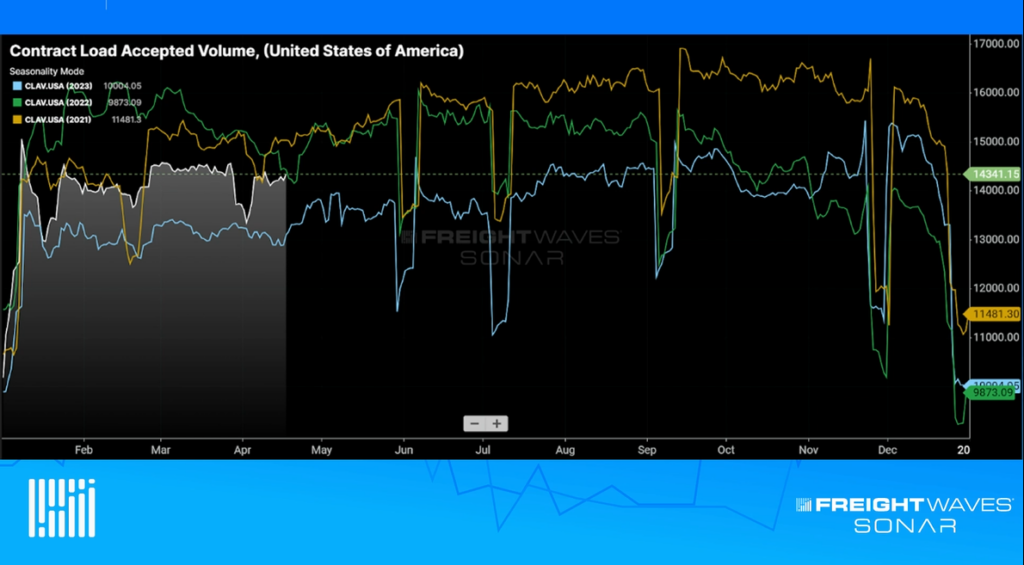
1. Supply chain participants rely on FreightWaves SONAR to access tender data and point of sale spot rate data to recognize shifts in the market immediately.
Tender rejections measure the percentage of contracted loads that were “rejected” or turned down by trucking companies because they have better options, better rates, in the spot market.
Consequently, trucking companies will aim to keep trucks moving and inherently overcommit to contracted freight due to the inconsistency of freight demand. The cost of not having a load is far greater than the penalty for rejecting it.
FreightWaves SONAR monitors rejection rates (0-100%) as a way to monitor market conditions in the truckload market. This rate measures the percent of contracted loads that are rejected by carriers.
Because truckload is a commodity, a declining rejection rate suggests that carriers are losing pricing power, while an increasing rate suggests carriers are gaining pricing power.
By examining SONAR’s Outbound Tender Volumes, Outbound Tender Rejections, and Inbound Tender Volumes, users can understand capitalism at a per market level. Supply chain participants should monitor these tender metrics to ensure that margins are protected, prices are fair, and carrier performance is up to par.
In layman’s terms, Outbound Tender Volumes = freight available, Outbound Tender Rejections = market sentiment/tightness or looseness, and Inbound Tender Volumes = capacity available.
Supply chain participants utilize SONAR’s Outbound Tender Volume Index (OTVI) to monitor the outbound volumes in the markets they operate in. Shifts in freight volumes may lead to changes in capacity, applying upward or downward pressure to carrier rates. If a market’s outbound volume suddenly increases, users can see which types of loads will be affected based on length of haul.
For visibility into rate fluctuations, use SONAR’S Inbound Tender Rejection Index (ITRI). Lanes with an elevated ITRI signal logistics leaders to extend tender lead times or open up more carrier options. On the other hand, the Inbound Tender Volume Index helps users view inbound capacity into their markets. Changes in the number of inbound trucks allows freight participants to react to market conditions proactively to ensure loads are covered.
Want an easy win? Look at markets where Outbound Tender Volumes are increasing, Outbound Tender Rejections are decreasing, and Inbound Tender Volumes are increasing. This is an indicator of loosening capacity, and in this scenario shippers can make strategic decisions to protect margins and improve tender acceptance.
2. Logistics leaders navigate market volatility via SONAR’s high-frequency supply chain market intelligence.
Best-in-class companies utilize the best data and understand lagging load board data won’t cut it as the calendar rolls over to 2023. Truckload rates built on historical payments data fails to show a clear picture of current market activity, leaving you with limited visibility to manage transportation partners.
SONAR’s high-frequency data tracks upstream cargo movement, revealing activity months before the point of consumption. In other words, supply chain leaders are equipped to navigate volatility with data that justifies decision making and hold carriers accountable for price and performance levels.
High-frequency market data allows supply chain participants to drive growth, mitigate risk, and pinpoint cost-savings opportunities. SONAR customers that leverage SCI (Supply Chain Intelligence) reduce transportation costs by 2-8%.
Interested in seeing how much money you could be leaving on the table? Our dedicated SONAR experts can review a small sample of your lanes to identify opportunities. Even if you’re overpaying by only 3% in your network, how would that percentage alter upcoming bid negotiations and budget forecasts?
To learn more about why load board-driven freight data is heavily skewed and shows extreme flips in the load to truck ratios that are not truly representative of market conditions, check out The Freight Market Waterfall Theory.
3. Freight participants adjust their mix of contract and spot logistics volume with reliable data that speaks to anticipated capacity and rates.
Being proactive in a disruptive situation separates the good from great companies. Relying exclusively on the spot market breeds instability and hinders customer service levels. The differentiated data within SONAR allows logistics leaders to capitalize on opportunities ahead of the competition and position themselves as an expert to customers.
By raising contract rates in certain volatile key lanes identified by SONAR, one CPG shipper slashed its spot market exposure in half and cut its truckload spend by 10% on the lanes it put out to bid. The same shipper shared, “The initial results were better than expected, generating a 10% savings in transportation spend. Overall exposure to the spot market was roughly cut in half, from 20% to 11%.”
According to Gartner, “By 2025, 70% of public companies that outperform competitors on key financial metrics will also report being data-and-analytics centric.” SONAR is powered by millions of third party data points. Unlike legacy data providers, our supply chain intelligence doesn’t rely on a participating network to drive data integrity and relevance.
SONAR’s unique tender data represents loads that have yet to deliver. Leveraging this with point of sale spot rate data allows decision makers to recognize shifts in the market immediately. This gives SONAR users a strategic advantage over companies that rely on freight invoice data and load board activity.Want to know how you can use SONAR to improve on-time-in-full metrics and increase tender acceptance? Request a demo to talk with an expert.


