Skip to content
WHY SONAR
Close WHY SONAR
Open WHY SONAR
Why SONAR
SONAR Tools
White Papers
Key Features
Make more strategic business decisions and outperform the competition with SONAR’s full suite of products.
Our Data
Stay on top of supply and demand dynamics across all modes of transportation with SONAR’s best-in-class data and analytics.
LEARN MORE
SONAR SCI
Actionable insights to help shippers, carriers and 3PLs reduce costs, improve route guide compliance and make proactive decisions.
API
A customizable data analytics plugin that delivers the power and flexibility that modern supply chain businesses need — with more control and less risk.
Market Dashboard +
A multi-lane analysis tool designed to empower bid management, frequent lane monitoring and corridor trend visualization.
Container Atlas
Data insights and trends around vessel delays and price fluctuations to help users mitigate risk and make more informed and profitable decisions.
Index-Linked Contracts
Optimize pricing and relationships by creating dynamic contracts based on the source of truth for the supply chain industry.
TRAC
High-frequency and accurate pricing data on volatility, rates and capacity to improve margins and contract negotiations.
NTI
A real-time proxy for the health of the national supply chain used by freight and non-freight businesses to make more accurate decisions.
September 13, 2024
Q3 Freight Rate Report
Read More
September 10, 2024
FreightWaves SONAR August State of Freight
Read More
August 16, 2024
FreightWaves SONAR: An Early Warning System for Investors in Emerging Markets
Read More
VIEW ALL
WHO WE HELP
Close WHO WE HELP
Open WHO WE HELP
Who We Help
Solution Guides
Case Studies
Retail
Optimize your retail transportation network with better data and intelligent RFPs
CPG
Cut transportation costs intelligently with high-frequency data
Automotive
Optimize freight cost and service in your network with high-frequency data
Healthcare
Derisk your health care supply chain with high-frequency freight data
Paper & Packaging
Balance cost and service with better freight procurement
Financial
Leverage SONAR supply chain data as a leading indicator in the economy
Other Industries
Use SCI to balance cost and service and hold your supply chain partners accountable.
Broker / 3PL
Use SONAR to widen margins, win more freight, benchmark against the market, and forecast contract and spot rates.
Carrier
Use SONAR to maximize trucking rates and fleet utilization while minimizing operating costs
LEARN MORE
Understanding the Freight Cycle
The Waterfall Theory of Freight illustrates the critical importance of maintaining high routing guide compliance to control shipping costs and what might happen if these routing guides fall apart. Tools like SONAR enable transportation providers to track tender volumes, rejections and market imbalances, providing valuable insights into freight trends. By leveraging these tools, SONAR users can better navigate the complexities of freight logistics, ensuring more efficient and cost-effective operations.
Download Solutions Guide
Unlock Leading Indicators for Drayage Demand
While SONAR doesn’t contain drayage rates yet, certain data sets provide a look forward at demand that can help carriers be nimble with timely adjustments to resource levels. Total drayage capacity in a particular market doesn’t typically change much from day to day or week to week, but demand can fluctuate based on the volume of containers coming off the docks or into a rail yard.
Download Solutions Guide
Ocean Data for Global Logistics Optimization
The Container Atlas application in SONAR illustrates supply and demand in the ocean market by showing spot rates in addition to numerous other supply and demand metrics outside of rates, such as bookings information.
Download Solutions Guide
VIEW ALL
May 6, 2024
Ardent Logistics Success Story
Read More
April 22, 2024
Pink Panther Success Story
Read More
April 8, 2024
Desirable Logistics Success Story
Read More
March 22, 2024
How RGL Logistics Became a Trusted Advisor With SONAR
Read More
February 1, 2024
Packer Freight Case Study
Read More
January 17, 2024
River City Logistics Case Study
Read More
VIEW ALL
RESOURCES
Close RESOURCES
Open RESOURCES
Read About It
Watch & Learn
Blog
White Papers
Enrich your knowledge in the areas of freight and supply chain intelligence, understand market movements, and stay informed on the latest trends.
Case Studies
Real-time supply chain intelligence in action. See how our customers and partners benefit across the globe.
Release Notes
Access brief, high-level descriptions of enhancements and new features of SONAR.
Articles
Each week, market commentary from the update video is put into an article that can be read, based on the notes from the weekly video.
Infographics
Access engaging visual representations of common trends and happenings within the industry
Inside SONAR
SONAR moves and changes as fast as the freight markets. We’re continually updating and enhancing our data and product feature set. Get the inside scoop on SONAR updates.
Index Reference Guide
Our exclusive market indices provide uses with a wealth of knowledge and insight. The map will guide you through the data sets and indices that are right for yours needs.
FreightWaves TV
Our award-winning team combines the best in broadcast journalism with the diesel in our veins as we bring you the inside scoop on what’s happening in freight right now. From deep dives to fast facts, FreightWaves TV covers the world of freight like no one else.
Webinars
Join us if you’re new to SONAR, need refresher training, or want to learn more about our data sets. Watch the on-demand SONAR 101, 201, and 301 webinars hosted by our Customer Success team and Market Experts.
Podcasts
A full trailer load of freight podcasts from FreightWaves. Enjoy shows like the award-winning WHAT THE TRUCK?!? podcast, Put That Coffee Down, and more.
September 12, 2024
Your Playbook for Winning This Shipping Season
Read More
September 5, 2024
Key Insights from the Logistics Managers Index: Shippers and Supply Chain Professionals
Read More
August 29, 2024
How Labor Disputes Impact Freight Markets
Read More
August 22, 2024
Why Intermodal Spot Rates Haven’t Moved With Volume
Read More
August 13, 2024
Why 3PLs and Carriers Should Use SONAR to Get Ahead
Read More
August 8, 2024
The Importance of Analyzing Both Spot and Contract Rates
Read More
VIEW ALL
PARTNERSHIPS
ABOUT US
Schedule Demo
Login
Infographics
The 10 Trucking Trends in 2021
Jason Vanover
January 15, 2021
Read more
A Guide to Carrier Benchmarking KPIs
Jason Vanover
January 8, 2021
Read more
The 6 Hallmarks of A Shipper of Choice
Jason Vanover
December 18, 2020
Read more
10 Ways to Lower Detention and Demurrage Risk With Ocean Data
Jason Vanover
December 11, 2020
Read more
4 Types of Transportation and Freight Analytics
Jason Vanover
December 4, 2020
Read more
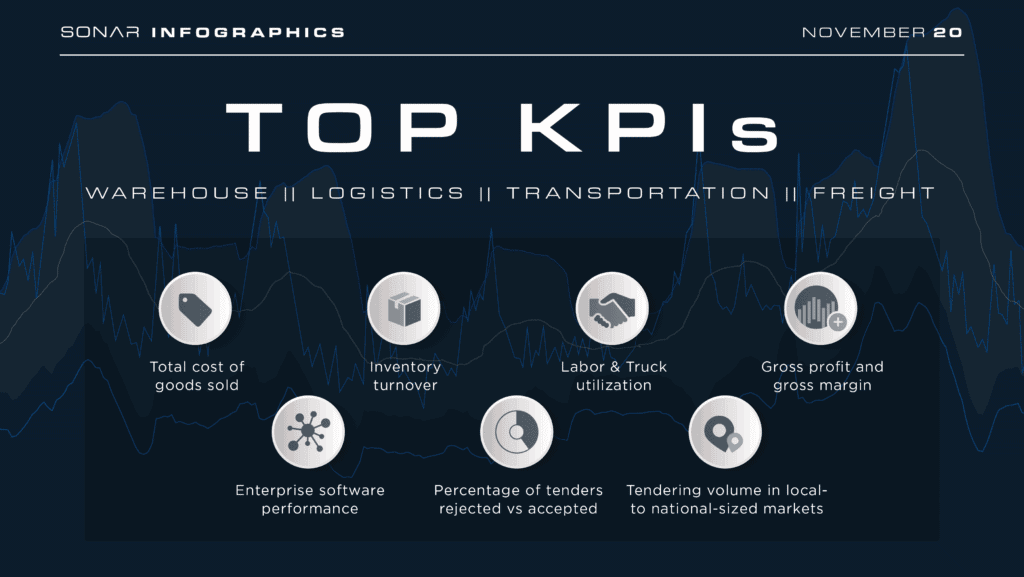
Top KPIs in Supply Chain for Warehouse, Logistics, Transportation, Freight
Jason Vanover
November 20, 2020
Read more
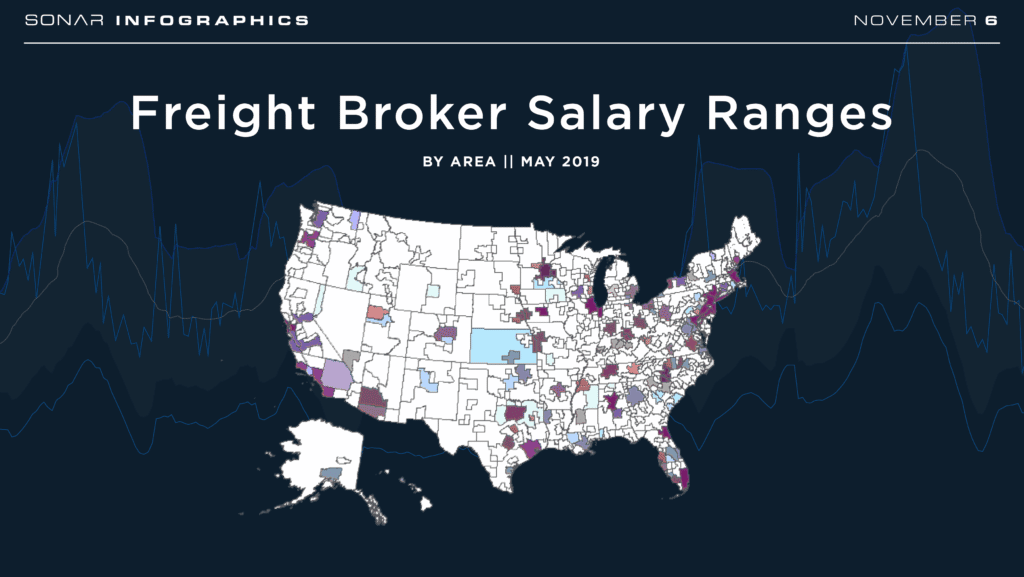
What are Freight Broker Salary Ranges?
Fergus Caldicott
November 6, 2020
From https://www.bls.gov/oes/current/oes434011.htm For example, brokerage clerks in New York have an annual mean wage of $70,890. But that’s still below the annual wage of those in the 90th percentile....
Read more
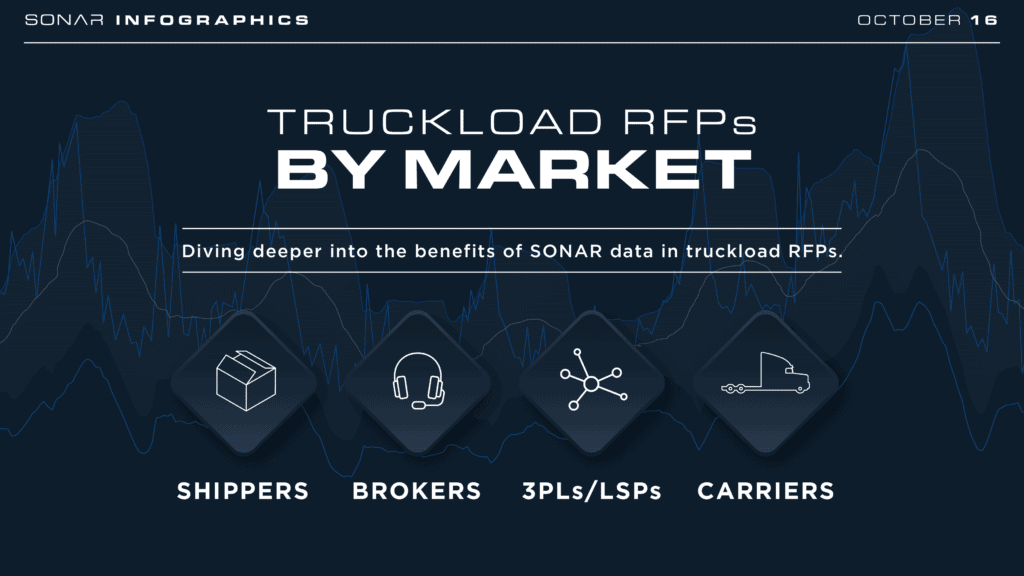
Using SONAR Data to Improve Carrier Sourcing and Scheduling
Fergus Caldicott
October 16, 2020
Request a SONAR Demo
Read more
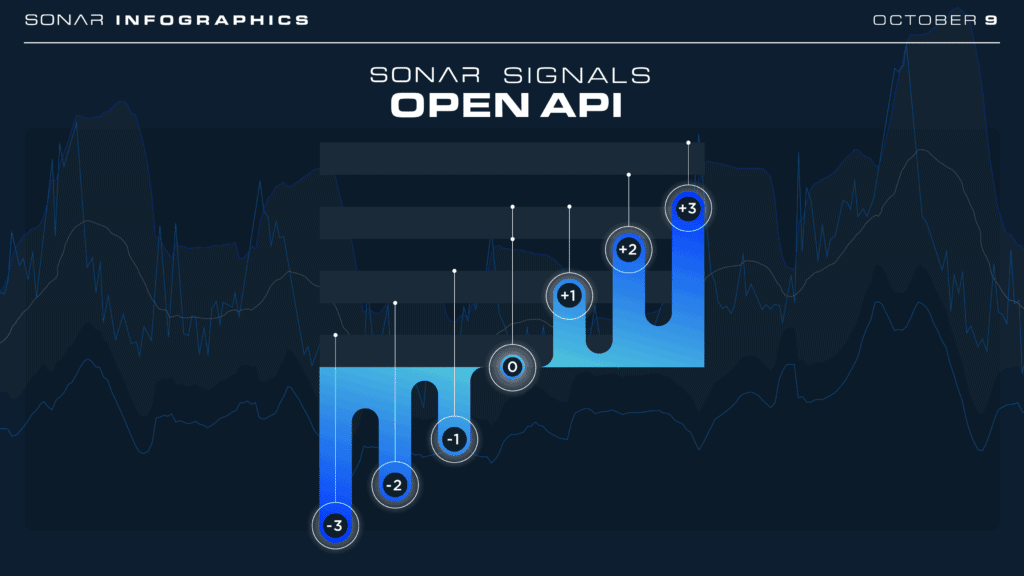
How FreightWaves SONAR Signals Open API
Fergus Caldicott
October 9, 2020
Read more
Freight Negotiations
Fergus Caldicott
October 2, 2020
Read more
Understanding The True Trucking Rate For The Market
Fergus Caldicott
September 25, 2020
Request a SONAR Demo
Read more
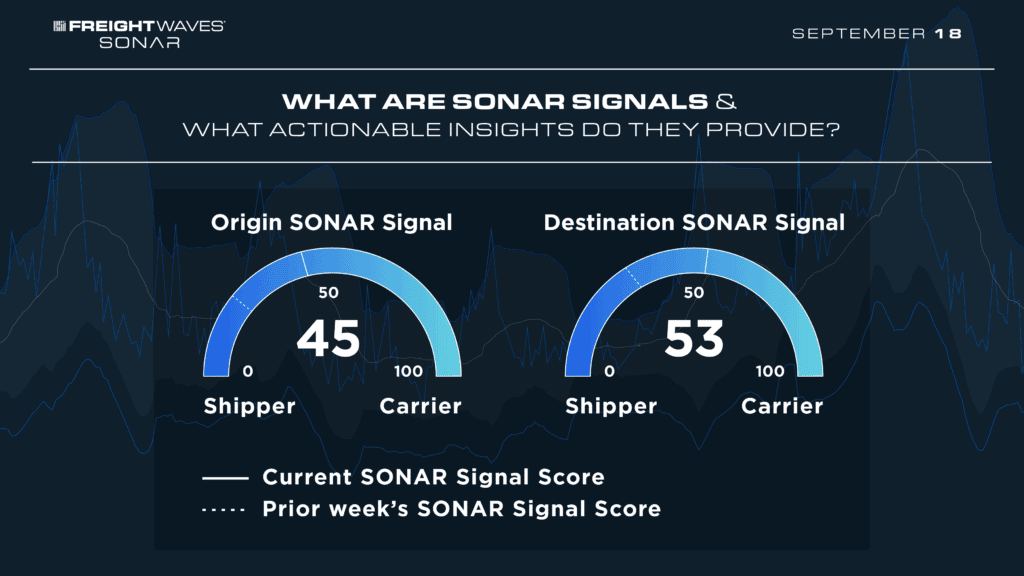
Improve Freight Market Volatility with SONAR
Fergus Caldicott
September 18, 2020
Request a SONAR Demo Learn more about Lane Signals
Read more
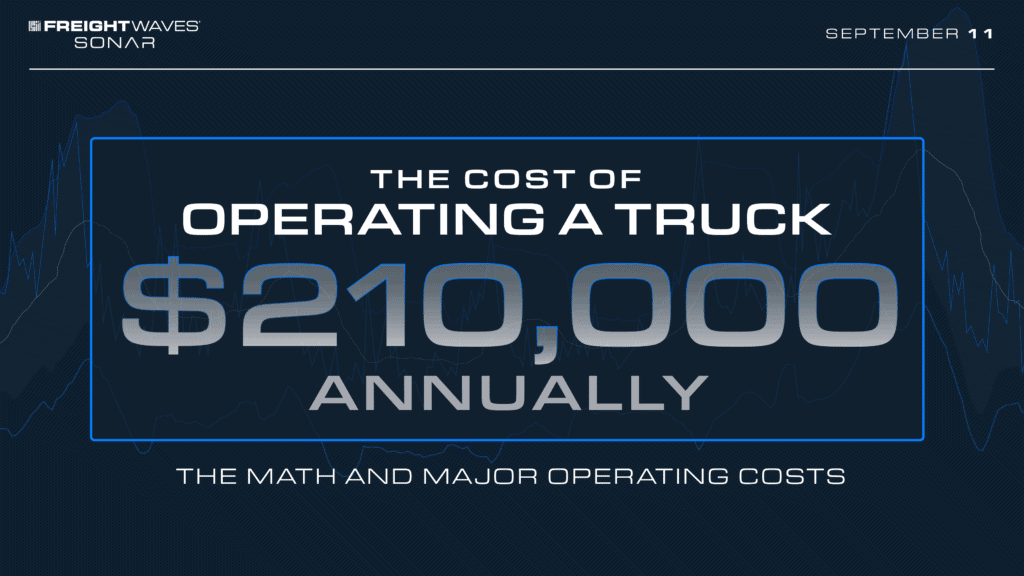
The Cost of Operating a Truck
Fergus Caldicott
September 11, 2020
Request a SONAR Demo
Read more
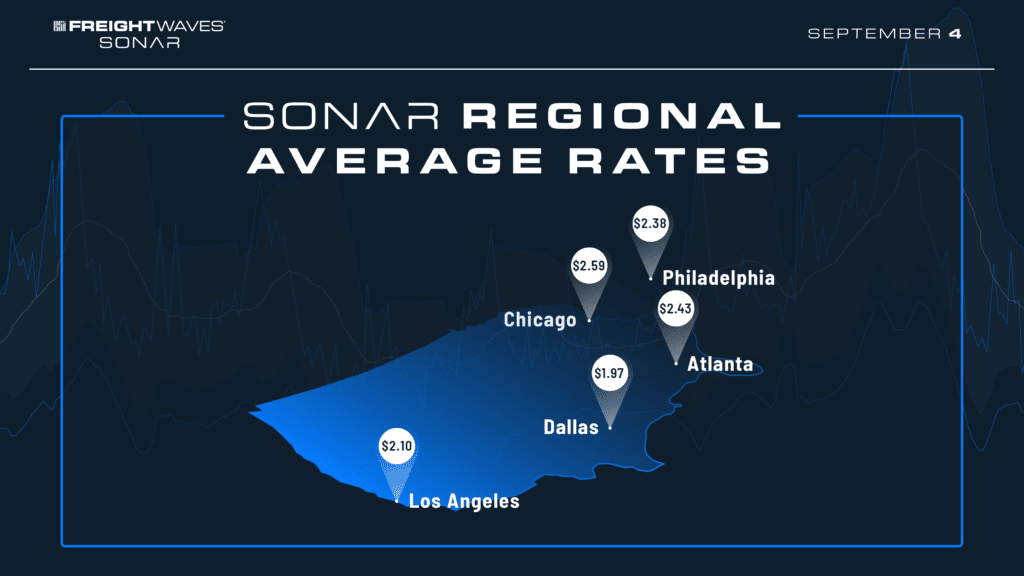
Trucking Rates per mile September 2020
Fergus Caldicott
September 4, 2020
Read more
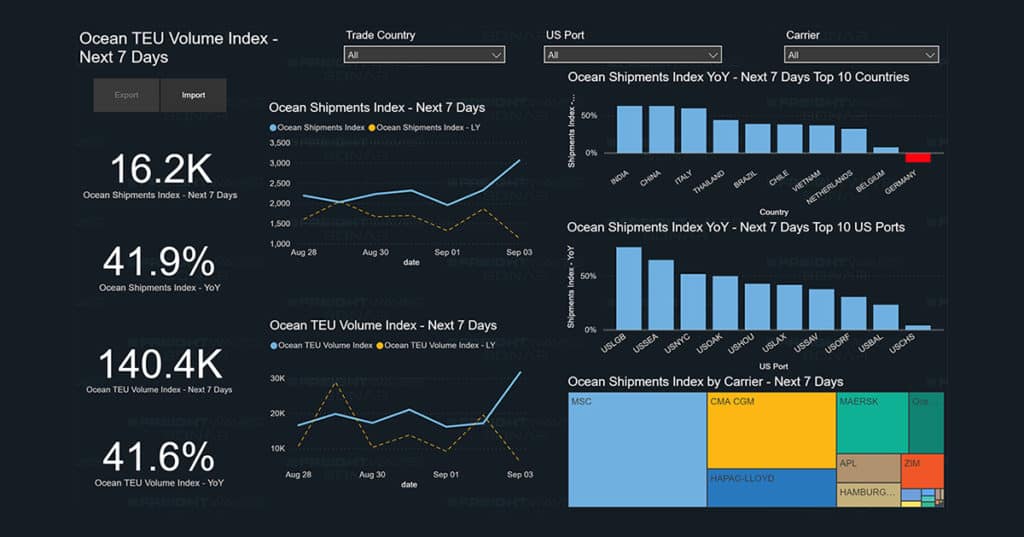
The Benefits of Ocean Freight Data in SONAR
Fergus Caldicott
August 28, 2020
Read more
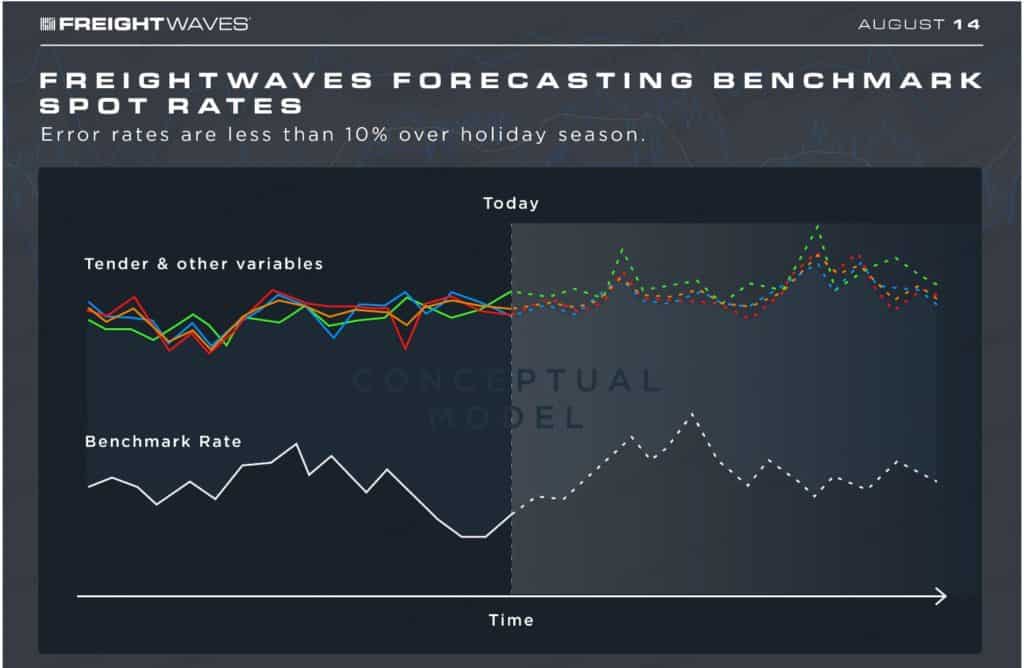
FreightWaves SONAR Forecasts of Benchmark Spot-Rates: Infographic
Fergus Caldicott
August 14, 2020
Request a Demo of SONAR today to start forecasting the rates on the spot market and keep your freight spend in check.
Read more
Load More
SONAR App
SONAR SCI
Actionable insights to help shippers, carriers and 3PLs reduce costs, improve route guide compliance and make proactive decisions.
Market Dashboard+
A multi-lane analysis tool designed to empower bid management, frequent lane monitoring and corridor trend visualization.
TRAC
High-frequency and accurate pricing data on volatility, rates and capacity to improve margins and contract negotiations.
API
A customizable data analytics plugin that delivers the power and flexibility that modern supply chain businesses need — with more control and less risk.
Container Atlas
Data insights and trends around vessel delays and price fluctuations to help users mitigate risk and make more informed and profitable decisions.
NTI
A real-time proxy for the health of the national supply chain used by freight and non-freight businesses to make more accurate decisions.
Index-Linked Contracts
Optimize pricing and relationships by creating dynamic contracts based on the source of truth for the supply chain industry.
Why Sonar?
Features
Make more strategic business decisions and outperform the competition with SONAR’s full suite of products.
Data
Stay on top of supply and demand dynamics across all modes of transportation with SONAR’s best-in-class data and analytics.
Learn More
White Papers
September 13, 2024
Q3 Freight Rate Report
Read More
September 10, 2024
FreightWaves SONAR August State of Freight
Read More
August 16, 2024
FreightWaves SONAR: An Early Warning System for Investors in Emerging Markets
Read More
View White Papers