

SONAR supplies the global supply chain with the intelligence needed to make faster and smarter decisions regarding capacity, rates, trends and forecasts in markets around the world. With SONAR, users have access to the largest data repository and most advanced geo-based mapping UI that has ever been brought to market. This enables users to fully exploit the potential of benchmarking their in-house data alongside data from the rest of the industry across all modes of transportation.
In SONAR, you have access to real-time location information for 100% of the world’s ocean and air cargo assets via the most advanced satellite and GPS tracking on the market. While monitoring 100% of capacity, users can drill into demand-side data sets that only SONAR has organized in one place, enabling users to catch trends in demand that can provide an edge in the market or give users leading indicators of imbalances in supply and demand that will affect their operations. Having access to SONAR international shipping data provides users with the competitive advantage and risk management capabilities they need to gain an edge in the market while simultaneously de-risking their supply chains.
Data Granularity
SONAR data provides the most granular data sets for US maritime imports.
Modal Breadth and Depth
We are the only solutions provider that can also tie those containerized imports to truckload and rail moves.
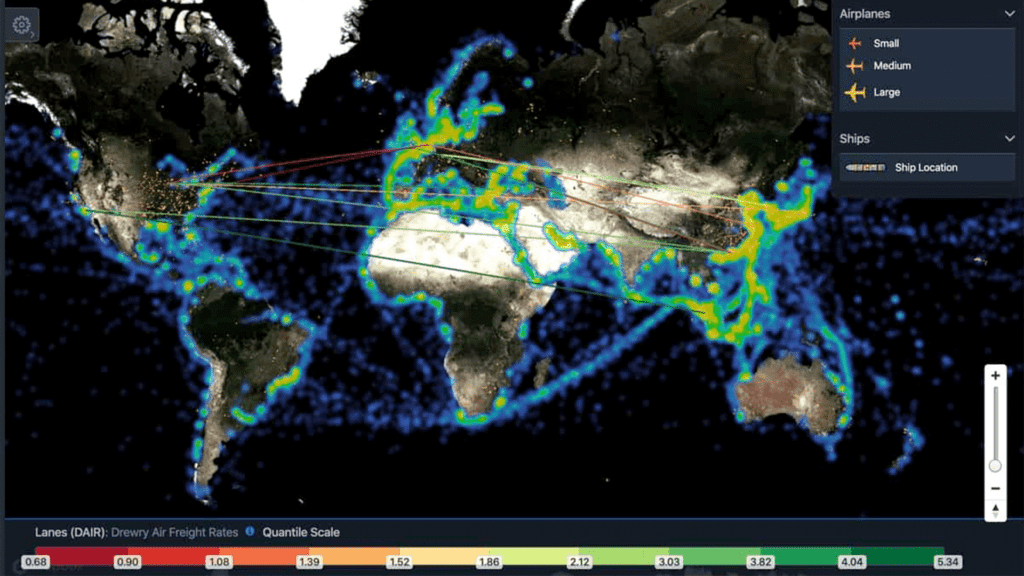
Visualization
We have the most dynamic visualization tools to showcase and analyst domestic and international data.
Time Series Analysis
Our data structure provides the best solution for time series analysis.
Expertise
Market experts have deep domain expertise to derive insight into the complexity of the international supply chain.
SONAR is truly a multi-modal near-time freight market dashboard and includes daily volumes for intermodal containers moving within and between freight markets in North America – including bi-directional container volumes between the U.S., Mexico and Canada.
SONAR will also display the inbound and outbound container volumes by both load status (empty/loaded) and length of the container (20’, 40’, 45’, 48’ and 53”) between major freight markets. Combined with weekly intermodal spot rates on 105 origin-destination pairings, this will give SONAR users an unprecedented view into the intermodal freight market.
In the U.S., intermodal represents about 46% of all railroad traffic each week. For shippers, brokers and carriers, it represents a competitively priced capacity alternative, especially in the long-haul freight sector, where supply chain flexibility allows longer lead times. Intermodal also allows railroads, ocean carriers, trucking companies and intermodal marketing companies (IMCs) to take advantage of the best attributes of various transportation modes from within SONAR to yield an efficient and cost-effective overall freight movement for customers.
How will SONAR benefit you? SONAR’s intermodal tickers will also allow SONAR users to better understand the volume of containers:
The major benefit for SONAR users of daily intermodal volumes comes from a near-time view of international trade flows at major ports since intermodal volumes in SONAR also incorporate traditional 20- and 40-foot international shipping containers.
Users will also be able to measure capacity or when demand is exceeding supply as well as general rate increases. When volumes surge in maritime lanes, as with trucking, the rates also increase. Increasing rates can be a leading indicator for increasing freight volumes entering the U.S., potentially creating market disruption.
SONAR users get access to two major container spot rate indexes – Drewry and Freightos Baltic.
The Drewry World Container Index represents the average weekly spot rate for shipping a 40-foot container in seven of the United States’ largest maritime shipping routes. SONAR users get insight into lane-specific rates in the following:
The Freightos Baltic Daily Index measures the daily price movements of 40-foot containers in 12 major maritime lanes between countries. It is expressed as an average price per 40-foot container. This index is the world’s only ocean container pricing index that is reported daily.
In addition to average daily prices across 12 major maritime lanes, the difference between FBXD.CNAW and FBXD.CNAE is offered as FBXD.PANA. This is the price differential between shipping a 40-foot container from China to the North American West Coast and the North American East Coast.
SONAR offers a proprietary index that helps track the relative attractiveness of using West Coast or East Coast ports to ship Asian exports – FreightWaves calls it the ‘Panama spread’ (SONAR code: FBX.PANA).
The Panama spread reflects a simple calculation – we subtract the rate to move a container from China to the North American West Coast (FBX.CNAW) from the China to North American East Coast rate (FBX.CNAE). The trans-Pacific trade lane is one of the world’s busiest and most volatile, and container rates are affected by steamship line capacity, demand and canal fees (both Panama and Suez).
In addition to the Panama spread (FBXD.PANA), there is another version that includes intermodal spot prices to the major Midwest market, Chicago, so that shippers, freight forwarders and intermodal marketing companies can get a better read on the competitive landscape.
IMSPRD.PANA measures the difference between the all-in rates to ship goods from China to the Midwest through West Coast ports and East Coast ports. Specifically, we combine daily maritime container spot rates and weekly intermodal spot rates to compare the costs of moving freight from China to Chicago on different lanes.
The index is measured in dollars – a positive reading tells SONAR users how much more expensive routing Asian freight through the East Coast is in dollars per container; a negative reading indicates that East Coast lanes are at a discount to West Coast lanes.
The intermodal-adjusted Panama spread is of interest to beneficial cargo owners, freight forwarders, NVOCCs, railroads, intermodal marketing companies and port authorities that are trying to decide how to import Asian goods into the center of the United States or that are competing for import business.
IMSPRD.PANA tells SONAR users the cost difference between importing Asian goods via ocean container and intermodal rail to Chicago via West Coast ports like Los Angeles versus using East Coast ports like Savannah. The index helps shippers and freight forwarders make decisions about the most cost-effective way to move freight. The index also helps intermodal marketing companies, railroads and port authorities understand the freight marketplace and compete to win freight.
SONAR shows the monthly total of containerized freight volumes imported and exported at U.S. ports and for the country as a whole. There is also a proprietary index that shows the spread between imported and exported containers at U.S. ports.
Loaded TEU volumes at major U.S. ports are very good indicators of freight volumes moving into, and out of, subsequent port cities. Looking at the spread (difference) between loaded import and export TEU volumes can assist in identifying the trade imbalance at a given U.S. port. If a port handles more loaded import TEU volumes than loaded export TEU volumes, then one can assume that the port serves as a major destination for U.S. imports rather than it does as a major origin port for U.S. exporters.
Since around 90% of global trade occurs via maritime shipping, the loaded TEU spread can also assist in understanding the overall health of U.S. trade in the global economy. If loaded TEU import volumes are increasing, and the loaded TEU spread is also increasing, then that means that loaded exports at that port are either decreasing or staying the same. Conversely, if loaded TEU import volumes are decreasing, and the loaded TEU spread is also decreasing, then one can assume that loaded export volumes are either increasing or staying the same.
SONAR shows all maritime import volumes as reported by U.S. Customs. While 100% visibility into every single shipment is elusive, we are confident that our maritime shipping data shows between 85-90% of all maritime imports. It encompasses both containerized and non-containerized shipments. Shipment volumes that clear customs are indexed in SONAR, with a 7-day moving average, showing volumes by port.
Additionally, SONAR is broken down by commodity-level information on about 75-80% of the data. SONAR users can use trade and maritime shipping data to predict surface freight volumes, including rail intermodal and trucking. Loaded TEUs imported into U.S. ports as reported by each respective port authority. 20’, 40’, 40’ High-Cube, and 45’ equipment types are contained in the data (i.e., one 40’ container would be represented as 2×20’ TEU containers).
Port Import Market Share of U.S. Customs Maritime Import Shipments (PIMS).
This is the market share that each U.S. port is capturing of the total U.S. Customs Maritime Import Shipments on a monthly basis.
This displays maritime shipping data related to import shipments into the US as reported by Customs and Border Patrol (USCBP). This is the total number of import shipments and includes both containerized and non-containerized goods.
This is available in the follow time frames:
The Drewry Global Container Port Throughput Index is a growth/decline index representing ocean container trade volumes at 220 ports around the world. This is an indicator of whether global shipping container volumes are growing or declining at major ports worldwide. If the index is growing we can assume that global trade is expanding and greater volumes are flowing between ports. If it is declining, we can assume that global trade is slowing and fewer ocean containers are moving between ports.
Petroleum trade data – Petroleum trade data tracks exports, imports and the trade balance in the U.S. economy for petroleum fuels. This data is monthly, non-seasonally adjusted, and reported as thousands of barrels per day.


