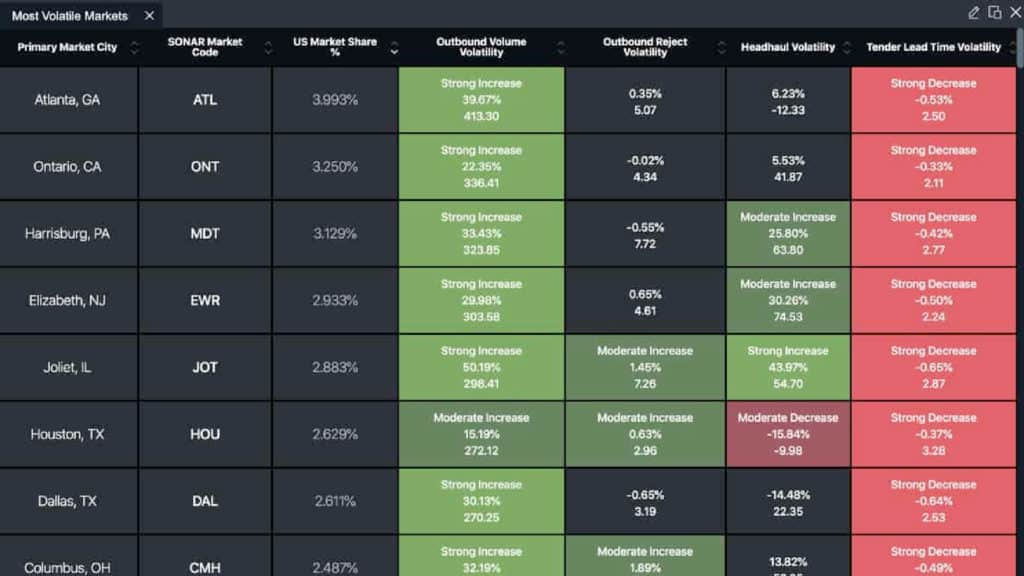
The Most Volatile Markets dashboard within SONAR analyzes all the major indicators that suggest a market is about to change direction.
In any given market, there’s a certain level of volatility that is considered normal. Movements outside of those fluctuations can indicate a market will realize a crunch or oversupply of capacity, for example. SONAR helps measure the not-so-normal movement of specific indexes for a market, resulting in actionable insights. SONAR’s Most Volatile Markets dashboard gives you this visibility in real time.
Display all markets or select those that are essential to your operation.
Further filter this feature to either all selected markets or those with volatility outliers.
Markets can then be prioritized by:
Primary Market City Name:
SONAR Market Code
U.S. Market Share %
Outbound Volume Volatility
Outbound Reject Volatility
Headhaul Volatility
Tender Lead Time Volatility
Outbound volume volatility:
A sudden change in outbound volume indicates that the capacity map will be impacted, which directly correlates to capacity availability and changes in rates.
Since SONAR presents near-time data and it can take weeks for the entire market to realize demand has changed, you’ll have the edge to take action before the competition.
Outbound reject volatility:
A sudden change in tender rejections means that the capacity map is shifting.
A rapid increase in tender rejections means that carriers are gaining an advantage in the market and have better pricing power.