The Heat Map feature gives you an overview of market conditions across the U.S. The ability to paint the map with SONAR indices gives you a quick and easy visual to prioritize actions based on a real-time comparison of specific market conditions. From truckload tender rejections to intermodal box movement by size and load, to imports and exports by maritime and air, it’s easier than ever before to see the national market at a glance.
Layering of additional information including facility locations, rail lines, location weather forecasts, road surface conditions, traffic, and 50,000 DOT camera live feeds provide unparalleled visibility.
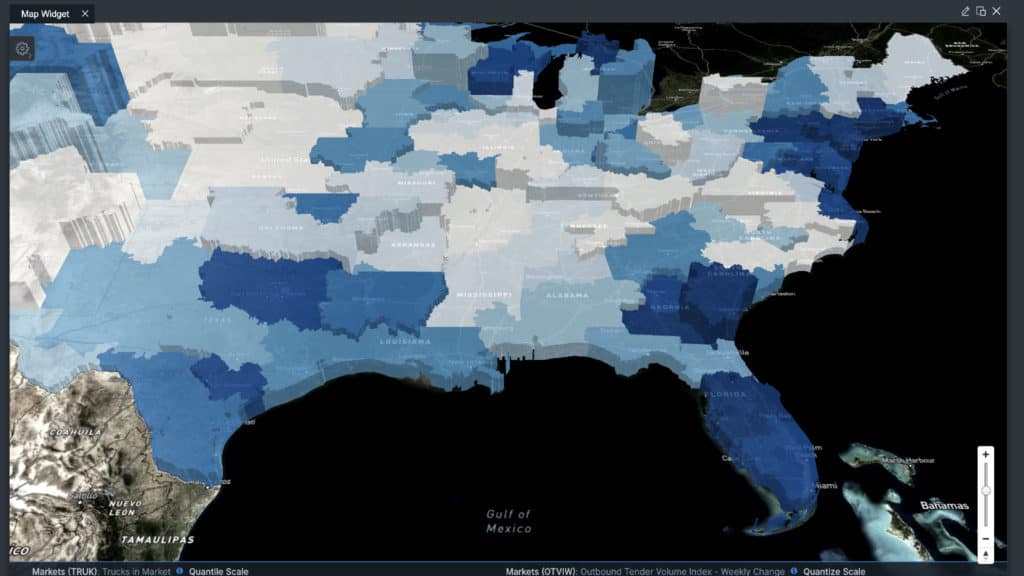
Paint heat maps with market data – easily select an index to prioritize your teams focus. Where is capacity tightening or loosening? Where are rates likely to rise or fall? Where do you need to focus on securing capacity? Where should you be positioning assets?
Many indexes can be displayed as daily values or as weekly, bi-weekly or monthly changes.
Use the 3D map to compare indexes.
Market volatility function – quickly visualize the most volatile markets across the U.S.
Show market details on hover – moving the cursor over a market provides more in-depth information.
Lanes – gain immediate insight into capacity, shipment volumes and rates across domestic and international lanes by truck, rail/intermodal, air and maritime.
Chart directly from map – clicking on a market accesses all index values for the selected market. You can even launch charting capabilities to gain actionable insights.
Upload locations – upload your company’s or customer’s locations into a secure environment to easily visualize market conditions by location.
Layer in rail lines – easily visualize all or selected rail lines against rail shipment and intermodal box movements.
Road conditions – see real-time and forecasted road surface conditions.
Infrastructure – layer in airport and seaport locations over SONAR’s air cargo and maritime indexes for quick analysis of cross-modal capacity and volume activity.
Vehicle traffic – real-time visibility of road, air and maritime traffic.