History tends to repeat itself, or does it? A common thought in the trucking industry is that looking at historical spot rates are good indicators of what to expect each year. It is true to an extent that historical trends do well to predict certain aspects of future spot rates, such as seasonal movement, but they are almost useless in predicting the magnitude or any diversion from normal activity. To get a more accurate forecast of rate activity, you need to also include forecasts for the items that drive rate volatility such as volumes and carrier capacity.
Forecasting freight rates is a lot like forecasting the weather. The weather forecasters look at seasonal average temperatures as an indication of when to expect general seasonal changes in temperature, but do not use them as the primary figure for daily, weekly or even monthly forecasts. To predict the short- to mid-term temperature, they utilize much more complex models involving a multitude of variables, including atmospheric pressure and moisture content.
Predicting spot rates with only historical rates would be a lot like using the average temperature over the past few years to predict the temperature tomorrow.
In other words, using historical rates to predict future rates is a good way to predict when the market will potentially change, but not with any precision.
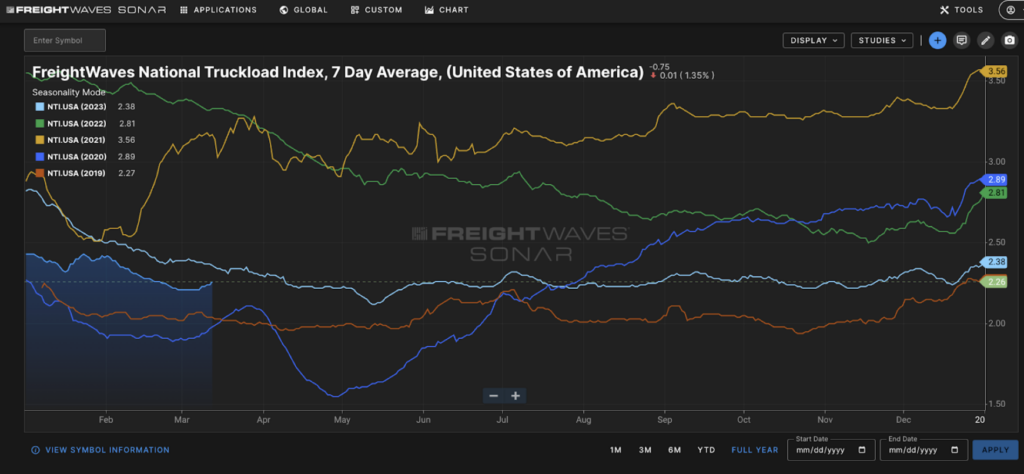
Looking at the average national trucking spot rate over the last five years, there are consistent peaks and valleys occurring around July 4th and the holiday season. Those peaks can vary wildly from year to year. For instance, the average trucking spot rate the week ending June 24 in 2018 was $2.09 per mile excluding fuel. The same week the next year had an average rate of $1.56 per mile, a 25% decline.
Many people would discount the 2018 example as an anomaly, but from a historical perspective the years from 2012-2017 were considered one of the most consistent periods of freight market activity with the economy experiencing consistent growth until exploding in late 2017. Taking a sample from the middle of this period, the average trucking spot rate on November 23, 2014 was $1.76/mile while the same week in 2015 produced a $1.46/mile rate. Single data points are simply not sufficient even in consistent times.
As stated earlier, the reason rates fail is the fact they are the end result of a number of factors, and any one of those factors can dramatically alter the outcome. Spot rates are a product of several things including but not limited to:
- Carrier costs
- Demand (requested trucking volume)
- Capacity (number of trucks available)
- Distribution of freight/market dynamics
Using data from all of these areas are necessary to predict a rate with any precision.
The first item on the list is often the most overlooked but is probably the most important in determining the rate. Most of the rate is direct coverage of carrier costs. In a good year carriers only average margins in the 5%-10% range, meaning 90%-95% of the rate is going straight to the cost of moving the freight. Carrier costs can vary dramatically by lane depending on their networks. For example, a carrier may have a great deal of contracted freight moving into Los Angeles but takes whatever it can get to come out of the area on the spot market. This item cannot be ignored, being the biggest portion of the underlying rate.
Once the costs are determined you need to begin evaluating the market or external forces that drive freight transportation rates, which is simply supply (trucking capacity) and demand (trucking volumes).
A common misunderstanding of spot rates is that they are representative of surging underlying demand all the time. The two seasonal peaks in the spot market are products of supply side contraction as well as elevated demand. Retail freight increases with holiday consumption, but drivers are also taking more time off the road for vacations, one around July 4th, which is the second most vacationed time of the year with the first being around Christmas. Having information on these two items in your predictive model from the contracted freight market, which is where most dry van freight moves, is crucial to identifying the market influence on your rate.
The last major factor is having something that accounts for how all these items work together on a national level. Changes in freight flows as shippers ebb and flow throughout the year help refine how national rates will move. Knowing when market balances are changing from heavy inbound to outbound allow you to account for potential rate changes. For instance, Los Angeles became more of a heavy outbound market year-round in 2019, driving rates down as carriers became accustomed to more freight.
Obviously, the more data you have in any model, the better it gets at prediction. Using a single data point such as spot rates will only give you base seasonality at best.
To develop the most accurate forecasts in the freight market, FreightWaves acquired load tender data representing an estimated 85% of electronic tender requests in the market. This dataset pulls from electronic load tenders, or load requests, that are sent to truckload carrier operating systems, known as TMS providers. These load offers almost always from the contract freight market. The contract freight market represents an estimated 85% of all loads in the trucking market.
As the carriers respond to load tender offers, FreightWaves SONAR monitors whether the carriers accept or reject loads. Because the load requests are sent up to a week before the loads are set to pickup, it tells us the state of capacity in the contract trucking market over the next week. And because the trucking contract market determines the level of activity that ends up flowing into the spot market, monitoring this data allows us to predict what will happen with freight rates over the next few weeks.
To get access to the most current data and freight forecasts, test drive FreightWaves SONAR.
FreightWaves SONAR has the most current data in the freight industry. SONAR aggregates billions of dollars of the electronic freight tender data in the market, allowing users to see how carriers are responding to new load opportunities. Tender data is combined with trucking spot pricing data and IOT sources, including ELDs, freight payment services, TMS providers, and other fundamental data from the freight market.