Freight volumes
SONAR’s outbound tender volume index (OTVI) measures electronically tendered truckload volumes across the U.S. Overall OTVI is indexed to 10,000 (March 1, 2018) and is the aggregated volume in 135 U.S. freight markets. OTVI is the most accurate near-time view of the full truckload markets. Freight forecasters use the OTVI index to monitor which markets are hot (i.e. surging volumes) and which are heating up and cooling off on a daily basis. Seasonal trends can also be monitored as OTVI also offers weekly, two-week, monthly, and yearly changes for each market.
Truck capacity
Freight forecasters can monitor full truckload capacity with the outbound tender rejection rate (OTRI). OTRI measures the percentage of electronically tendered contract loads that are rejected by carriers. The lower the percentage of rejections, the looser the truckload capacity in a market. As tender rejections rise in a market, truckload capacity climbs as carriers reject tender offers because they do not have a truck available or have options for higher-paying freight.
In freight markets where OTVI truckloads are rising and inbound load volumes are declining, routing guides break down as there is more freight than truckload capacity. This waterfall effect creates rising truckload spot rates. Using SONAR, freight forecasters can now monitor these markets with this near-time freight data to position assets and price more efficiently.
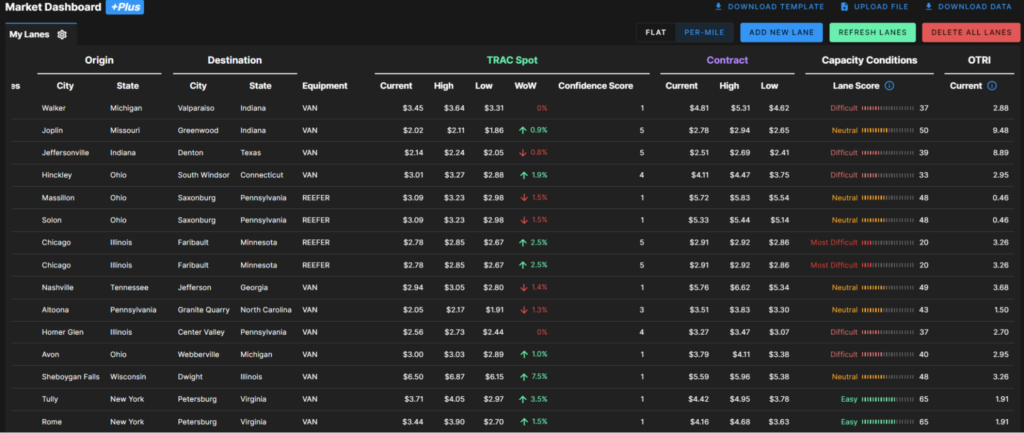
Lane Signals dashboard
SONAR incorporates OTVI, OTRI along with other freight market data in its Lane Signals dashboard. Based on SONAR data, each origin and destination lane pair is scored between 0 and 100 to gauge the pricing power in each market. A score of 50 indicates a balanced market. A score above 50 means that pricing power has shifted to carriers, driven by higher rejection rates. As a market loosens, scores fall below 50, indicating that shippers have the pricing power in the market.
Additionally, Lane Signals shows how truckload rates have changed on a week-over-week, month-over-month, and year-over-year basis. This allows freight forecasters to determine how pricing power for truckload lanes have changed over time. Forecasted rates are also included in Lane Signals, based on freight forecasts in all 135 freight markets in SONAR.
International freight
Freight forecasters can monitor international freight flows using SONAR maritime and ocean freight data. Customs import shipments (CSTM) is a seven-day moving average of shipments that clear U.S. customs through U.S. ocean ports. CSTM does not translate to truckload volumes immediately, as imports are loaded onto railroads or stored in warehouses until truckloads are able to be built for the replenishment of retail stores and other business transactions. Loaded imported twenty feet equivalent (TEU) containers also allow visibility into the number of TEUs that are moved through a given port.
Intermodal freight
SONAR provides freight forecasters with both intermodal container volumes (ORAIL) and intermodal capacity (IMOTRI). ORAIL offers both domestic 53’ loaded containers, international 40’ loaded containers as well as empty 40’ and 53’ containers. Empty containers give visibility into imbalances at ports as well as at intermodal hubs across the country. Intermodal freight is typically consumer goods that is not time-sensitive, due to shipments leaving an origin taking one to two days longer than shipments moved via truck.
Intermodal capacity as measured by intermodal tender rejections (IMOTRI) measures intermodal marketing contractors (IMCs) willingness to accept freight. IMOTRI tends to be less volatile than the truckload market, due to limited intermodal spot freight.
SONAR also provides service metric data for all of the Class I railroads. Class I railroads pride themselves on offering service to rival trucking, and SONAR includes both intermodal train speeds and rail terminal dwell times. Increased train velocity coupled with decreased terminal dwell times does equate to improved customer service by the railroads.
Economic data
Economic data provides the consumer and industrial demand that drives the freight economy. Freight forecasters should always monitor economic demand to monitor the expected future demand for freight.
The Institute of Supply Management releases a monthly survey regarding the manufacturing and service sectors of the economy. The survey ranges from 0 to 100 and values above 50 represent expansion expected in the next month and readings less than 50 represent contraction in a given sector. The ISM survey is forward-looking, allowing a better look into what is happening in the economy compared to other economic data that is reported for a previous month or quarter.
SONAR also has numerous other economic datasets that monitor all aspects of the economy. These data sets allow freight forecasters to predict and monitor where the freight market is headed.
If you are interested in tracking the freight market, including contract and spot rates, FreightWaves SONAR offers over 150,000 indices, most of which are updated daily. The world’s fastest, most accurate freight data includes trucking spot rate indices, tender indices, and market balance indices. SONAR freight tender indices are created based on actual electronic load requests from shippers to carriers, meaning you know that the index is measuring an actual load transaction.
SONAR offers proprietary data that comes from actual load tenders, electronic logging devices and transportation management systems, along with dozens of third-party global freight and logistics-related index providers like TCA Benchmarking, Freightos, ACT, Drewry and DTN.
SONAR offers the fastest freight market data in the world, across all major modes of traffic. The SONAR platform is the only freight forecasting and analytics platform that offers real-time freight market intelligence driven off actual freight contract tenders. Find out more about FreightWaves SONAR.