Forecasting trucking rates is one of the most important roles for all freight forecasters. Load volumes and truck capacity for individual markets are the primary drivers in developing freight forecasts. Each individual freight market has its own unique load demand and truck capacity cycles. These cycles are most often linked to seasonal demand patterns and the ratio of outbound to inbound freight volumes in each market.
Tendered load volumes – Freight forecasters can use several economic data sets in FreightWaves SONAR for freight demand forecasting. The most important, though, is the outbound tender volume index (OTVI) which measures tendered contract loads in 135 freight markets in near real-time.
Freight forecasters can identify historical patterns in specific freight markets to build scenarios of how freight demand will change over a defined time period. These trends will identify when truck capacity may tighten or loosen, which drives trucking freight rates. This is essential for creating trucking rate forecasts.
Tender Rejection Rates – Measures the amount of capacity in a freight market in SONAR. Outbound tender rejection rates (OTRI) is the percentage of contracted tender loads that are rejected by trucking companies. For example, if the outbound tender rejection rate for Allentown, Pennsylvania is 6%, it means that 6 out of 100 contract loads that are tendered are being rejected by carriers. The higher the tender rejection rate, the higher the capacity. This is true for both absolute numbers and the magnitude of change over a set time period.
Analyzing Freight Market Trends – Freight market trends are essential for analyzing each specific freight market to maximize profitability. The historical and real-time trends in a freight market tell the story of supply and demand, which is the foundation for building predictive freight rate models.
Contract rate trucking forecasts – Contracted volumes account for 85% of the full truckload market. Contract rates are an agreement between a shipper and transportation provider to move an estimated volume of truckloads for a fixed rate per mile. This agreement is not normally guaranteed and can be renegotiated by either party during the contract period depending on changes in market conditions and spot market rates.
Developing freight forecasts for contract trucking rates is most often based on historical freight market trends. The contract length can be anywhere from one month to 24 months, but the normal contract length is one year. Due to the nature of forecasting freight demand and capacity out for such a long period of time, freight forecasters assume the freight market will behave much the same in the future as it has in the past.
Spot rate trucking forecasts – The spot market represents the remaining 15% of the full truckload market. Like all other markets, the spot market is based on real-time freight market trends. It is a one-time transaction between a shipper and a transportation provider to provide short-term capacity at rates that reflect the current load volumes and truck capacity.
Shippers use the spot market as both a necessity and an opportunity depending on freight market trends. When capacity is tight, tender rejections and rates rise. Shippers then move freight to the spot market as a necessity to find capacity. When capacity loosens, tender rejections decline, and spot rates fall. At that point, shippers move freight to the spot market to lower freight costs.
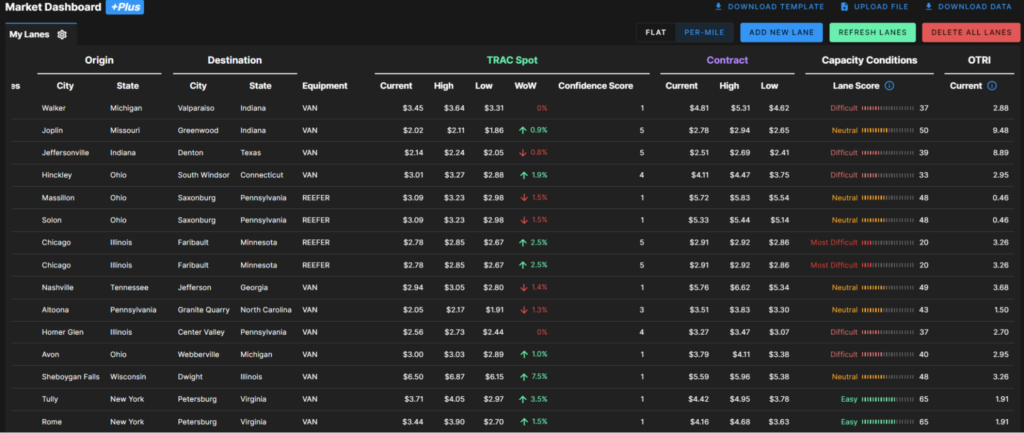
Predicting trucking rates – SONAR’s predictive rate tools use the near real-time freight market trends discussed above, along with several other data points to predict freight rates in 135 freight markets. This includes real-time freight rate predictions along with forecasts for one week up to one year in the future.
If you are interested in tracking the freight market, including contract and spot rates, FreightWaves SONAR offers over 150,000 indices, most of which are updated daily. The world’s fastest, most accurate freight data includes trucking spot rate indices, tender indices, and market balance indices. SONAR freight tender indices are created based on actual electronic load requests from shippers to carriers, meaning you know that the index is measuring an actual load transaction.
SONAR offers proprietary data that comes from actual load tenders, electronic logging devices and transportation management systems, along with dozens of third-party global freight and logistics-related index providers like TCA Benchmarking, Freightos, ACT, Drewry and DTN.
SONAR offers the fastest freight market data in the world, across all major modes of traffic. The SONAR platform is the only freight forecasting and analytics platform that offers real-time freight market intelligence driven off actual freight contract tenders. To find out more about FreightWaves SONAR, sign up for a demo to learn how to develop freight forecasts.