TRAC: Not just another truckload rate source
Everyone has rates. Rates are table stakes for supply chain performance. If you’re a leading shipper, broker or carrier and NOT using rate data, your partners and competition are likely outperforming you.
Wouldn’t you know it, FreightWaves SONAR has rates. In fact, SONAR rate data is the most up-to-date rate data in the entire supply chain industry. Introducing the leading spot rate data source: SONAR Trusted Rate Assessment Consortium (TRAC). FreightWaves TRAC collects data daily from a consortium of key market-driving companies adhering to IOSCO standardized protocols. Roughly 25% of the industry’s top 100 3PLs contribute actual booking data in order to drive transparency and accuracy into one of the most volatile data points: spot rates.
The key differences between TRAC and market competitors:
| SONAR TRAC | Other providers |
| Actual transaction data | Rates based on posted loads rather than the covered load rate |
| Captured at the point of booking | Captured retrospectively in historical invoices |
| Rates are always from the previous day | Rates are anywhere from 14-90 days old |
| Part of a more than $200B industry rate data source | Rarely representing more than $100B in any sort of data, regardless of accuracy |
| Scientifically monitored to remove bias or too-heavy weighting from individual providers | Unprotected from bias |
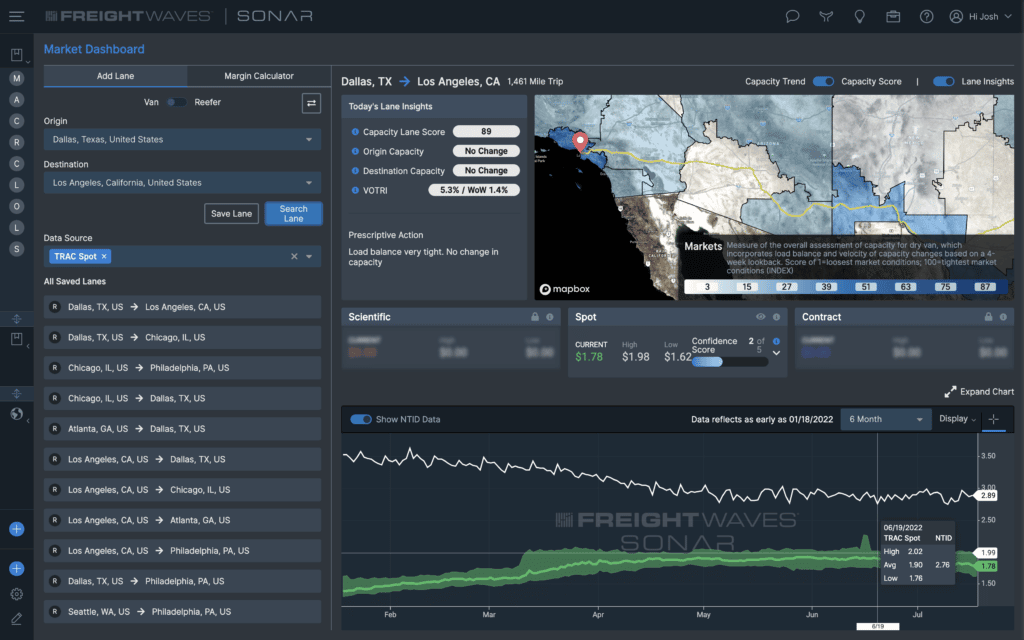
FreightWaves SONAR serves as the source of truth for leading logistics professionals. Whereas other industry players provide stale, lagging market indicators, TRAC leans on data that is typically less than 24 hours old to help subscribers make better decisions.
TRAC is part of the FreightWaves SONAR engine empowered by more than $200 billion in freight data:
- 715K van lanes and expanding
- 450K reefer lanes and expanding
- Updated daily
- Reinforced with statistical confidence scores
Negotiate in the spot market with confidence
FreightWaves TRAC is built with stringent methodologies so that your team can have the highest confidence to optimize freight spend. The SONAR team collects and aggregates spot rate data daily from among the biggest players driving the truckload market. Each of the more than 1 million daily TRAC lanes is built by at least five contributors, and no single contributor’s volume exceeds 25% of the analyzed total. On average we have more than 12 contributors per lane. The FreightWaves SONAR team then monitors for exceptions and outliers, leveraging data science to create an unbiased data source for your team. You can trust the timeliness and accuracy of rates to react to disruption a month faster.
Delivered via API to your TMS so your team can move faster
TRAC rates are available via API to be integrated into your TMS or system of preference so your team can effectively manage pricing where they live and breathe. Aggressively manage your spot and contract market exposure directly from your system of record. Leverage the most up-to-date freight data to make the strongest decisions and customize data application through APIs to bring use cases org-wide. TRAC rates are also integrated with the leading TMS providers, and it is adding new partnerships every month to become the most trusted and widely available source in the industry.
Want to learn more about TRAC? Click here to connect with us!