It’s easy to get trapped into a mindset of looking at the same datasets when working through analysis. They’re tried and true, they’re an industry standard, and typically easy to tie back to specific metrics. Alternative data is a bit off the beaten path; sometimes it takes a bit of creativity to connect the dots or interpret what it might mean for your particular segment. But once you nail it, you’ve found a nugget of insight that gives you a perspective and an advantage over the competition.
Alternative Data and Freight
For example, flatbed trailer types. It’s no secret that the two main contributors to flatbed volume are manufacturing and construction materials. Breaking it down further, the most significant component of construction spending comes down to residential spending.
Some analysts within the flatbed space understand the connection between the two industries and typically look at housing starts from the U.S. Census Bureau as a gauge for activity. This is an excellent start to see the latest housing trends. Still, more in-depth analysis can be done. By looking at Census Bureau housing permits data, that can be the next level of a leading indicator for intended construction activity coming down the line.
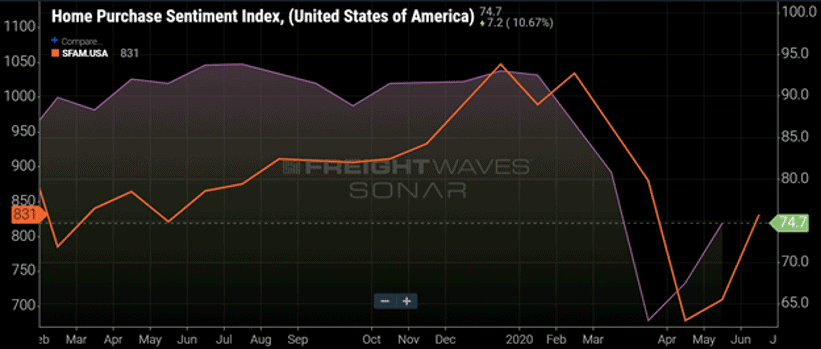
However, there is even more data to get even more information. One thing to note when observing the macro datasets above is that they primarily look at the supply-side of the equation. In the great words of Robert Collier, “Supply always comes on the heels of demand.” Demand is often overlooked and quite honestly hard to nail down with specific numbers, but it can be done. Consider the Home Purchase Sentiment Index, or HPSI, from Fannie Mae. This index paints a picture of demand by the U.S. consumer, while Single-Family Housing Starts reveals more about what’s going on the supply side.
The HPSI is a survey-based, forward-looking indicator with real-world implications. The national survey data is compiled every month and gauges consumers’ current outlook on the economy, how things will fare over the next 12 months and their perspective on buying and selling a home. The outcome is a single number index that is complementary to tangible results in the housing market and other areas of the economy. These include consumer spending and the transportation of building materials throughout the country.
Comparing Alternative Data to Traditional Data
The tricky thing about comparing supply-side data with the demand is that supply-side issues sometimes create a shortage. Demand can be high for homes, but supply-side issues such as available lots, labor shortages and supply chain constraints can impact home building, even when there is demand. Note the divergence between the two throughout much of early 2019 in the FreightWaves SONAR chart above. It’s vital to adequately perform due diligence when using these datasets to grasp all the variables within the segment fully and how it can impact your business.
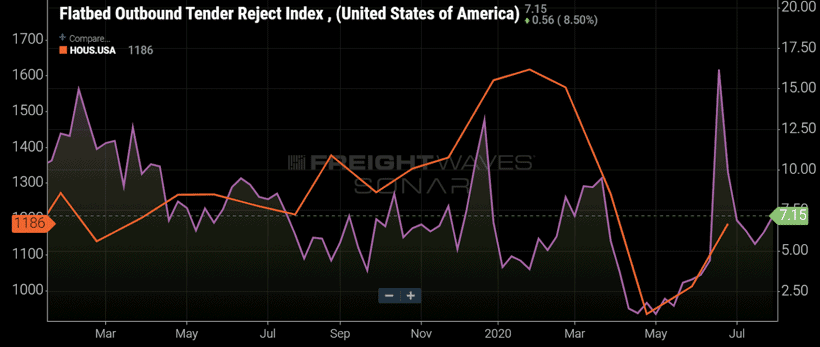
The recent rise in the HPSI (purple line) preceded the tick up in Single-Family Housing Starts (orange line). However, the most prominent leading indicator in today’s economic environment will be the path of COVID-19. Cases increasing in specific regions and states can and will limit activity that was previously primed for expansion and shock the supply chain of certain materials.
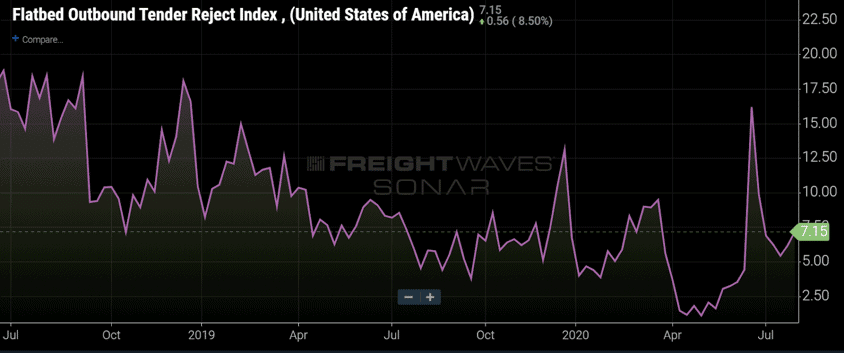
Each data set has limitations that can be compensated by analyzing multiple perspectives. Both the primary supply and demand-side data sets are released on a monthly basis, and that creates a lag. The Flatbed Outbound Tender Rejection Index has daily updates and shows current freight capacity for flatbed trailers, the primary equipment type that hauls these goods.
Alternative data is incredibly useful for getting a jump on underlying trends and should be used in unison with other datasets offering perspective to give a full landscape.