The SONAR team is ready with another “SONAR Indices & Insights.” Each week, you’ll learn about another index found within SONAR, the freight forecasting platform from FreightWaves. This week we’ll focus on the “Truckstop.com Volume” index and take a look at the Trucktop.com Rates Per Mile.
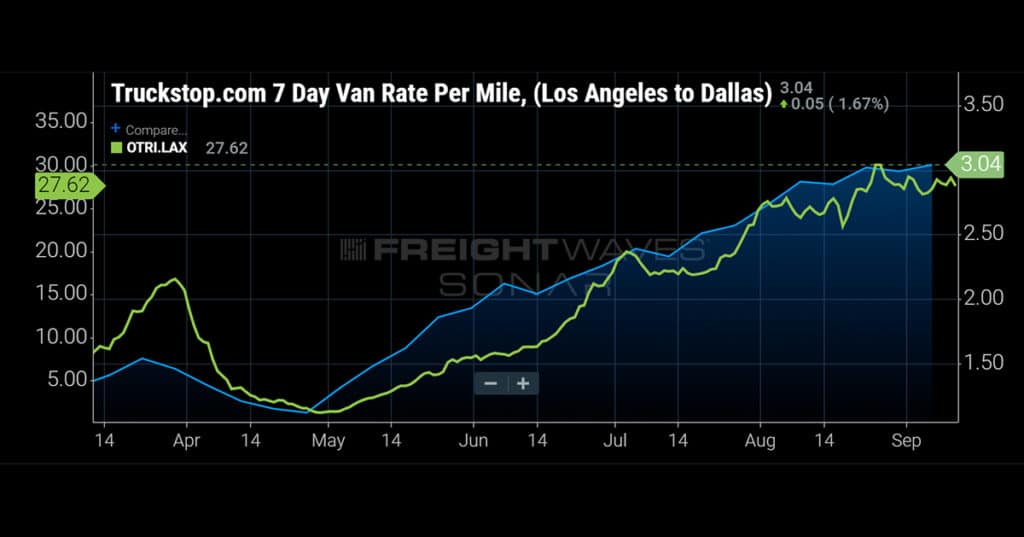
In the above image, you’ll see dry van spot freight rates for the Los Angeles-to-Dallas lane. So, let’s cover what are the Truckstop.com Volume index and the Rates Per Mile chart, what they both tell users, and provide a few insights from our market experts about the current state of the freight market by looking at other SONAR indices and reports in correlation to the Truckstop.com Rates Per Mile chart to see what insights freight participants may derive.
What is the Truckstop.com Volume Index and what does it tell users?
Truckstop.com examined volumes for van (TSTOPVV), reefer (TSSTOPRV) and flatbed (TSTOPFV) loads across the top 103 lanes in 2019. For each mode, the average weekly volume was set to an index value of 100. Any value below 100 would indicate that volume for that week was below the average for the same equipment type. Note that comparisons are only meaningful against the same equipment type. Comparisons across equipment types are not on equal scales. For example, a TSTOPVV of 90 means there were nearly 20% fewer van moves than a TSTOPVV of 110. However a TSTOPFV of 110 would not mean 20% more flatbeds moved than vans at a TSTOPVV of 90.
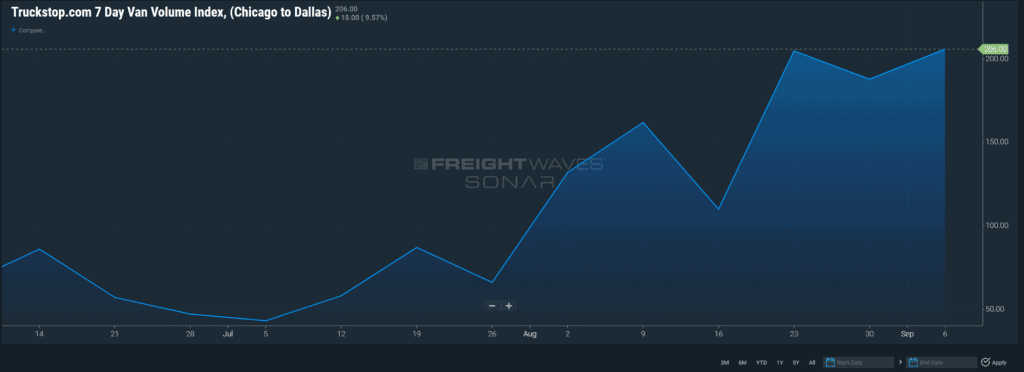
The Truckstop.com volume index is the average volume for the prior week, along the 103 most trafficked lanes.
What is the Truckstop.com Rates Per Mile Report and what does it tell users?
The Truckstop.com rates per mile report provides the 7-day average rate per mile along 103 of the most heavily trafficked lanes in the Truckstop.com Rate Analysis Tool database. The rates are available for van (TSTOPVRPM), reefer (TSTOPRRPM), and flatbed (TSTOPFRPM) modes. These weekly average rates are updated each Monday morning. FreightWaves research indicates that on any given lane, the highest and lowest rates in a single day can be different by hundreds of dollars. Between FreightWaves SONAR’s ownpredictive rates and the rates gathered by a respected brand like Truckstop.com, SONAR users now have an extra data point to aid rating decisions.
The Truckstop.com Rates per Mile report shows the average all-in (linehaul + fuel) cost/revenue (Bill of Lading amount) for the prior week, along the 103 most trafficked lanes.
Using Truckstop.com data with other features of SONAR for more effective freight planning
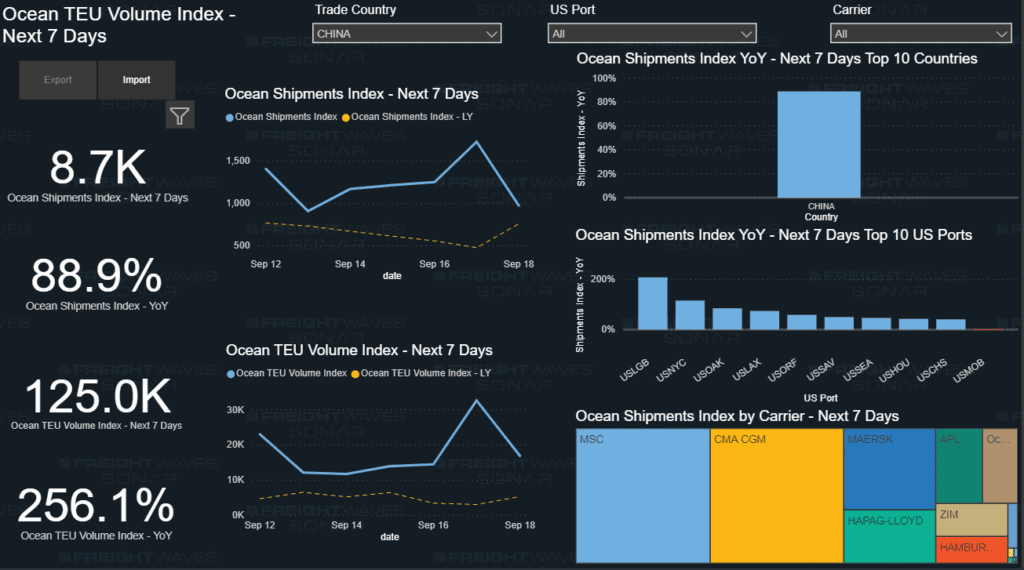
SONAR users can best use the freight forecasting platform by utilizing leading indicator reports, such as the Ocean Shipments Report, in addition to Truckstop.com Rates Per Mile to aid in freight rate and capacity planning.
For example, the FreightWaves Ocean Shipments Report shows bookings of U.S. imports from China are up 89% year-over-year (y/y) through next week, which is a good indication that freight volumes will continue to flow through the rest of September.
China remains the nation’s largest maritime import market by a wide margin, although there was a slight reversal in this activity during 2019 due to trade tensions between the two countries.
Most containerized freight coming from northern Asia still enters the U.S. through the southern California ports of Los Angeles and Long Beach, maintaining their status as the largest port complex in the country.
Spot rates and tender rejections have been on the rise out of Southern California since late April. Chart: SONAR – TSTOPVRPM.LAXDAL, OTRI.LAX
With Los Angeles remaining the largest recipient of trans-Pacific cargoes, southern California has become one of the tightest truck markets in the country.
All-in dry-van spot rates in the highly liquid Los Angeles-to-Dallas lane have climbed steadily from $1.12/mile in April to $3.04/mile by the first week of September, according to Truckstop.com. FreightWaves Outbound Tender Rejection Index (OTRI) showed an increase from 1.2% to 27% over the same period.
Other parts of the country are also experiencing tightening truck capacity. Spot rates from another benchmark lane, Chicago-to-Atlanta, have jumped from $2.14/mile to $2.93/mile over the past month, with tender rejection rates for Chicago climbing from 13.6% to 20% during the same period.
Unlike 2019, where many imports entered the country and sat in warehouses, this freight is moving throughout the U.S. as demand for certain products has jumped due to consumer lifestyle changes.
Electronic and household goods continue to experience double-digit growth as Americans spend more time at home due to COVID-19. Athleisure has replaced business casual on the apparel front. These pandemic-induced consumer trends will continue to shake up U.S. importer inventories in the months ahead.
The bookings illustrated in the Ocean Shipments Report are orders that have expected departure dates over the next seven days. For shipments to the U.S. West Coast there will be a two- to three-week transit time before they reach the ports. This means that freight will not be on a truck until late September at the earliest. The index has shown consistent year-over-year growth during the past few weeks, meaning that the flow of freight will not stop from the international side.