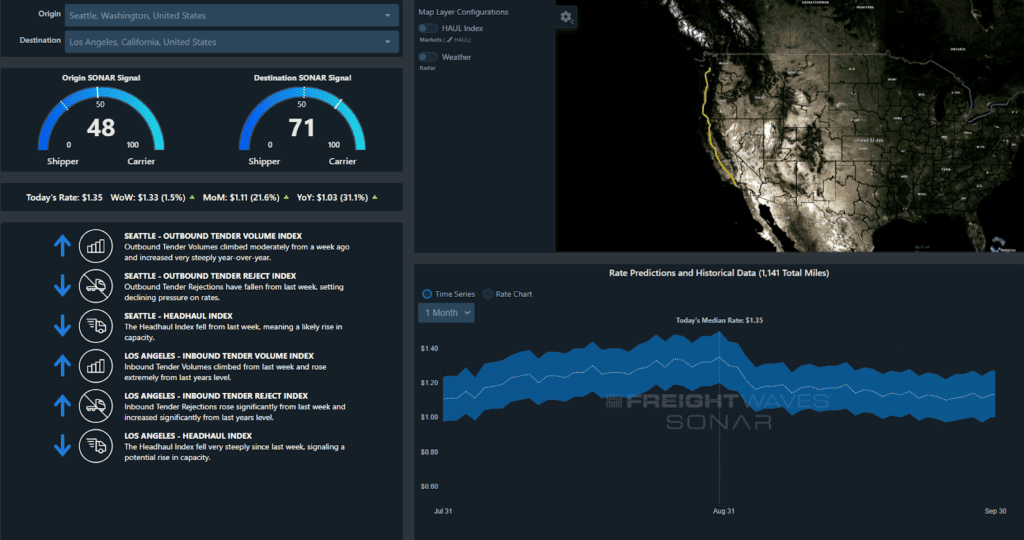
On the Lane Signal page above you can see the Seattle to Los Angeles lane displayed, with Seattle having a relatively low score – favoring a shipper looking for capacity – compared to Los Angeles, where there is a slight edge to a carrier looking to find freight.
How Lane Signal provides deep insights into a freight market participant’s lanes
With SONAR Lane Signal, users can access freight analytics down to the granular level of a lane. Lane Signal is a consolidated dashboard that gives shippers, carriers, and brokers real-time trucking spot rates, pricing power information, and volume and truckload capacity data on any origin-destination pair in the continental U.S. Lane Signal automatically aggregates and analyzes data from a number of sources to give operators a clear read into lanes they search.
Lane Signal’s Pricing Power gauges utilize numerous SONAR indices along with proprietary algorithms to distill and score whether a shipper or carrier has negotiating strength on a particular lane. The Lane Signal app shows the current day’s and the previous week’s negotiating strength on a lane-by-lane basis.
Let’s take a look at how various parties interested in granular lane data would use Lane Signal:
- Analysts: Analysts can use Lane Signal to dive deeper into individual lanes to see what factors are driving trucking capacity changes.
- Carriers: Carriers can use Lane Signal to see which lanes are tightening and loosening. They can then use this information to either negotiate freight rates or identify asset utilization trends. They can also see if destination markets are moving in a more favorable direction, influencing acceptance decisions. Pricing managers can see how lanes are performing on an annual basis and use this for annual bids.
- Brokers: Brokers can use Lane Signal to discern those lanes that will be more difficult to find coverage and where they will need to increase their rates on a daily basis. As with a carrier, the annual rate change information can be used in freight bidding management.
- Shippers: The signal and rate data give shippers insight into how much it costs a carrier to operate a lane and how much optionality they may have in a lane. Using this tool will give shippers a better understanding of potential risks to their daily transportation coverage, as well as changes in long-term truckload capacity trends in their lanes.
Lane Signal translates multiple data points into simple, understandable indices and a rate per mile while giving a historical perspective to establish a point of reference. The primary purpose of Lane Signal is to enable users to have a summarized view into each lane in a simple interface. Users enter their origin-destination pair in the top left corner and can see what the implied rate direction is today or is projected to be over the next several months. Using daily information helps you manage daily transactions while the longer-term information will help you manage the long-term transportation cycle with contracted business.
How to use Lane Signal with other SONAR charts and what it tells freight market participants
A hallmark example of how to use Lane Signal is during produce season. Each year’s produce season is important to any carrier or shipper that does not haul produce because it can have a notable impact on national truckload capacity due to the potentially high cost of moving this type of freight. Many reefer carriers will abandon contracted freight to cover produce markets because the operating margins can be so much higher, thus putting upward pressure on rates in non-produce sectors as shippers lose their carrier options. This is one reason the Reefer Outbound Reject Index for California (ROTRI.CA) was rising so rapidly in late May and early June 2020, an expectation freight market participants can reasonably have year-to-year during that time period.
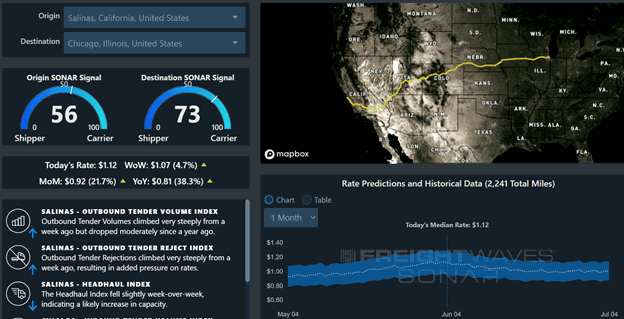
Why would carriers risk their relationships, though? The answer is simple – they can earn as much in one produce load than they can in multiple regular loads. Looking at Lane Signal application in its SONAR platform, a median cost carrier should be fetching around $1.12/mile moving from Salinas, California to Chicago. Assuming about $0.23/mile for fuel, this totals around $2,924, over $2,700 less than a load of produce on the same lane right now.