If you are a long-term investor in or a trader of trucking company stocks, we believe it is imperative to follow the FreightWaves SONAR outbound tender volumes index (OTVI) and outbound tender rejections index (OTRI). The reasons for this are two-fold: trucking stocks tend to trade based on a carrier’s financial performance; and future expectations for where the trucking industry is headed.
Trucking stocks tend to have a great deal of operating leverage; that is the percentage change in operating profit generally exceeds any given percentage change in revenue. Therefore, paying attention to minute details matters – a lot. Trucking company stocks’ high operating leverage derives from the fact that when revenue rises, operating expenses such as diesel cost per mile, driver costs, insurance and trucking lease payments are likely to remain flat (or at least not rise as fast as revenue). But because barriers to entry in the trucking industry are quite low (all a driver needs is a truck and a commercial driver’s license), conditions are very dynamic and profitability can erode quickly with only very small changes in supply.
Historically, trucking stocks have had a very high correlation with spot rates (DATVF.VNU). Intuitively this makes sense because spot rates, when they are rising and above contract rates, suggest upward pressure on contract rates in future rebidding negotiations with shippers. It also implies that as spot rates rise, both higher spot market activity and higher spot market rates mean accelerating growth for a minority portion of a given carrier’s revenue.
But the real reason that trucking company stocks move up when spot rates are rising is because, if the upward move is sustainable, it gets the whole financial model of a carrier rolling in the right direction.
For example, spot rates are likely to be rising because capacity is tightening in the market or demand is rising sharply enough that capacity is tightening even without any contraction in supply. Either is good news. And when spot rates move up, future contract rates then move up and contract revenue is the majority of a carrier’s revenue base (80% for the average carrier and about 90% for publicly traded truckload stocks). As spot rates, contract rates and load volumes climb, a carrier will see its revenue per truck per week ramp up, which translates into excellent operating leverage above a carrier’s fixed costs. If a carrier has debt, higher revenue per truck per week translates into explosive and even greater profit and cash flow growth. Then, as capacity increases and more trucks and seated drivers inevitably enter the industry to take advantage of attractive prevailing conditions, the whole cycle reverses and works in the opposite direction.
Simply using spot rates to inform investing and trading decisions when it comes to trucking stocks is incomplete and not ideal. For one, spot rates are incredibly volatile; it is not unusual for them to move up or down 50% or more from high to low in any given year. There is a very good reason that carriers do not depend on the spot market to make ends meet and pay the bills. In other words, with meaningful gyrations in spot prices being a way of life (and seasonality comes into play as well), it can be hard to separate the signal from the noise. A temporary, seasonal jump in spot prices may not mean that truckload stocks are an attractive investment beyond a few days or weeks. Second, given that 90% or more of a publicly traded carrier’s revenue is derived from contract revenue, it is vital to gauge how contract rates and contract load volumes are trending right now (especially to determine bottom line results and cash flow).
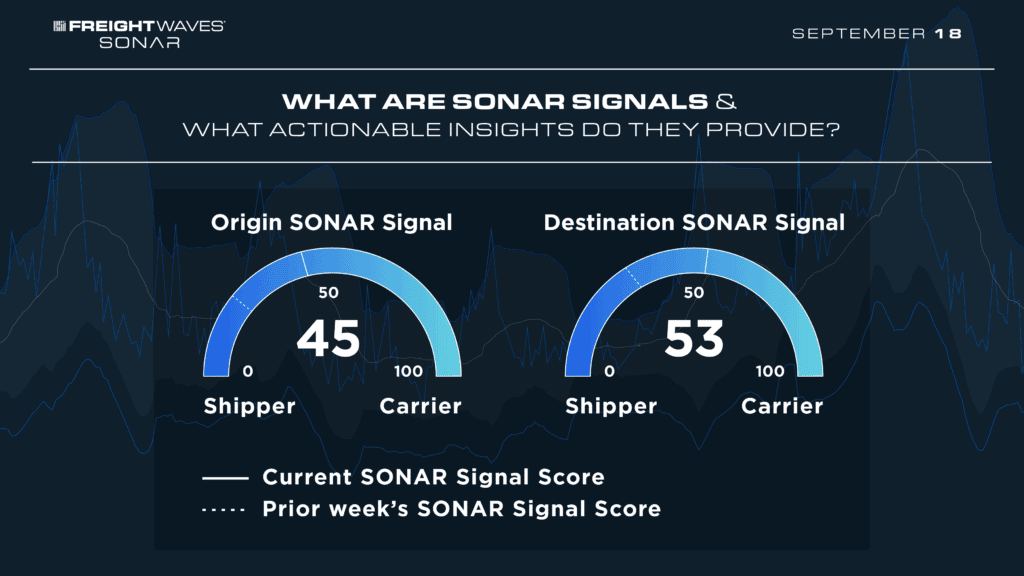
This is where SONAR’s OTVI and OTRI come in and we think these provide superior fundamental metrics for making sound investment decisions in trucking stocks. OTVI is an index with a March 2018 starting point of 10,000, and it measures the volume of electronic contractual load tenders taking place. Thus, OTVI gives us a pure, real-time read on contractual load volumes, which account for 90% or more of publicly traded carriers’ revenue. If we know what contractual load volumes are doing, when paired with recent spot rate movements, we can then have a good read-through to contract rates.
Lastly, OTRI measures outbound tender rejections of those same electronic contractual volumes being offered to carriers from their shipping customers. OTRI gives us the best real-time read on capacity, and therefore the best leading indicator of future pricing power for carriers. Historically, OTRI and spot prices are extremely highly correlated. If rejection rates are rising, this means that capacity is tightening. Carriers will increasingly turn down contractual loads for only one of two reasons – they are literally out of capacity to accept them, or they are rejecting contract loads in favor of more attractive, higher paying spot loads. Either condition is bullish for carriers and their stocks.
In summary, combining spot rates, contract load volumes and tender rejections from SONAR gives trucking investors and traders the most comprehensive view of the market possible. And these same indices and data points can also be watched carefully to identify inflection points, giving investors a leg up on the competition.
SONAR offers proprietary data that comes from actual load tenders, electronic logging devices and transportation management systems, along with dozens of third-party global freight and logistics-related index providers like TCA Benchmarking, Freightos, ACT, Drewry and DTN.
SONAR offers the fastest freight market data in the world, across all major modes of traffic. The SONAR platform is the only freight forecasting and analytics platform that offers real-time freight market intelligence driven off actual freight contract tenders. Find out more about FreightWaves SONAR.