
Spot market data is often referenced as a key indicator of activity in the trucking market. But trucking spot market data provides an incomplete and lagging view of market activity.
On April 15, 2020, I wrote an article entitled “Good News: The freight market is about to turn up.” It was the most polarizing article I have ever written, ranging from people that are optimistic and encouraged that the market may turn around to people that were overtly hostile to commentary that stated a view of the world different than their own. While I had projected that volumes would return to the market (albeit slowly) in the month of May, sentiment about the market is incredibly negative. For the most part, the comments I received were mostly constructive and even if they disagreed, they were well thought out.
When I originally wrote the article, the outbound tender volume index for the U.S. freight market (SONAR: OTVI.USA) was sitting at 8,763. Two days later, it continued to drop to 8,439. The 4% drop was significant for a few days and I started to believe that my assumptions were off. It appeared that the freight market was not in a bottoming phase. But three days later, the index jumped to 8,659, just 1% off where I had stated the market bottoming process in play. This was the first uptick we had seen in the data since March 23, 2020 and a sign that volume wasn’t deteriorating. As I write this update on April 19, 2020, the index is at 8,667.
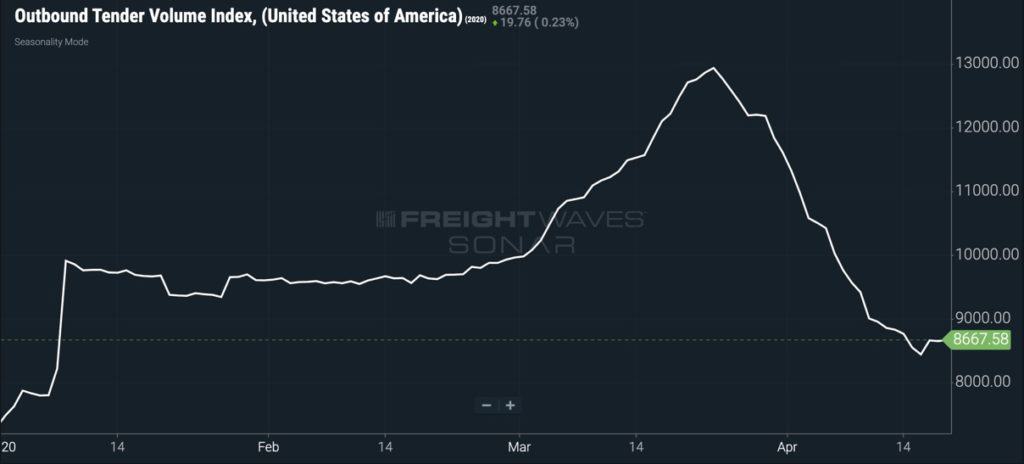
The OTVI index measures tender load volumes in the contract freight market. Essentially, it’s an index of outbound freight requests from shippers to carriers. The index is the real-time activity measurement in the contract freight market. In fact, since it comes from actual load requests from shippers, it is the most reliable leading indicator of activity in the trucking freight market.
Tenders are far more reliable and current than any other source, including load board postings or spot rate assessments. The reason for this is that loads are normally tendered a few days before they are set to pick up; they involve a contract relationship between a shipper and a carrier, since they must have some sort of electronic interchange between the firms (EDI or API); involve a single load transaction at a time; don’t suffer from behavioral manipulation like data that comes from load boards (i.e. load to truck ratios); and since the contract trucking market represents 85% of the overall for-hire truckload industry, activity in the contract freight market has a far bigger impact on industry economics than spot market activity.
When I consider the sources of comments I received regarding this piece, I found that there was a clear distinction between individuals that have far more exposure to the spot market or draw their conclusions based primarily on spot market data. The challenge is that the spot market will be a dumpster fire until after the contract market has improved. The spot market will have little volume and rates will be on the floor, until after the contract market comes back.
The reason for this is that when contract carriers see a significant downturn in load tenders from their committed shippers, they will take loads from the spot market. And since they only care about moving the truck to go back to a market where they have a committed contract load or to keep the driver moving, they don’t care about rate. This creates significant downward pressure on spot rates.
Right now, there are significant portions of the trucking industry that are offline. These include auto haulers and automotive parts trucking fleets, tanker trucks, and flatbed haulers. In the next few weeks, the auto industry will resume production and those trucks will go back to their contracted commitments. Tanker trucks, impacted by the lack of retail gasoline and jet-fuel demand, will continue to struggle as long as people avoid travel. Flatbed haulers have exposure to industrial, construction, and energy production demand. They will see some relief as industrial activity resumes, but will see muted volumes as commercial construction suffers from a soft real-estate market. Energy production, particularly in the oil and gas industry in North America, appears to be down for the foreseeable future, as the world is awash with so much oil that there is no place to store it. In fact, drillers in parts of North America are actually paying to have their oil hauled away.
The spot market is an important factor in the economics of the trucking industry. Pricing in the contract market only moves a few percent up or down each year, but the spot market can experience high double and even triple digit changes over the course of a year in certain markets. Truckload carriers that operate in the for-hire trucking industry tend to manage their business with a portfolio approach, much like someone would manage a portfolio of investments.
A company will have a percentage of their freight dedicated to contract, dedicated and spot. Dedicated loads are equivalent to high-grade bonds. Dedicated freight has predictable payouts and suffers from very little volatility. Dedicated contract freight offer carriers annuity-like business.
Contract freight that is priced properly should make up a large portion of a fleet’s portfolio. These loads are the equivalent of blue-chip stocks. They offer fairly predictable returns and tend to be stable and lack significant volatility.
The spot market is the highly speculative portion of the portfolio, suffering significant weakness during the downturn, but offering outsized returns during good times.
When times are good, a trucking company should be overweight in the spot market, but when times are soft, the company wants to have as little exposure as it can to the spot market. If a fleet has an outsized portion of its capacity dedicated to spot right now, it is likely seeing incredibly low rates and very little volume. A fleet with a concentration of spot market business could be at risk of bankruptcy in a market like this.
Load-to-truck ratio data offered by DAT is subject to a lot of manipulation by brokers and carriers alike. Brokers will post ghost loads that don’t exist, post the same load on multiple load boards, or even duplicate versions of the same load. To make it more enticing to the carrier, the broker will show a different geography than where the load is to be picked up or is destined. At times, brokers will post loads that don’t exist for price or market condition discovery. This helps brokers assess the market conditions on a lane.
Even DAT employees admit to not policing the posting data on their load board on Facebook posts and other internet message boards.
Getting data on the carrier side of the equation is harder, but for different reasons. Carriers are reluctant to post trucks knowing that brokers use this information to jam the carrier with a super low rate. For many carriers, it is a sign of desperation to post their capacity and often a last resort when there are few loads available. The truck postings that do exist are dominated by a very small number of large carriers.
For this reason, it is hard to get reliable information on the balance of the freight market. This is how you end up with load-to-truck ratios of 50 loads to 1 truck in certain markets, something that is not tied to reality in the physical world.
DAT is working to address some of the challenges with the load to truck ratios with their Market Conditions Index (MCI), but it is still drawing from the same data set of load board activity. Like every freight market data set, the data is only relevant as the part of the market it pulls from. In DAT’s case, their market analytics data comes exclusively from their load board, a very small percentage of the overall massive freight market. Plus, DAT hasn’t presented a solution to prevent ghost postings or market manipulation.
Spot rates are important pieces of information about the health of the truckload market. Spot rate assessments come from two sources: self-reported rates from participants; and freight payment services (factoring data). Self-reported rates are submitted from brokerage transportation management systems, usually at the point of billing. Brokerages vary on what they submit and are left with some discretion (e.g. fuel, accessorials, team transit, hazmat and detention). Some brokerages submit a daily file of truckload spot rates; others send in a weekly report. Rates that are pulled from billing activity provide a different level of visibility because they are taken from billing activity in the market and the reporting agency has a chance to create a consistent methodology for what is included and what is not.
Regardless, spot rate assessments are lagging indicators of activity in the market. Spot rates are given at the point of quote, before the load picks up. A large portion of loads that are quoted in the spot market have been tendered to contract carriers, but rejected. In other words, loads that enter the spot market overflow from the contact market. These loads have already shown up in the tender data.
Since tender index data in FreightWaves SONAR is less than 24 hours old and often posted before rejected loads are sent over to the spot market, we can get an early indication of market activity. Spot rate data, while providing important information about the market, doesn’t reflect today’s activity for at least a week, since most of this data is sent at the point of billing.
So what does all this mean? We are not going to see any level of increases or surges in the spot market data until after we see tender volumes increase. Spot market increases will only happen when the contract market shows steady increases and while outbound tender volume index (OTVI) data appears to be showing some upticks. An increase in the contract market will then still be a bit away.
The outbound tender volume index is available to SONAR subscribers. If you are interested, test drive SONAR today.