In this edition of “SONAR Indices & Insights,” readers will learn about FreightWaves SONAR’s Weighted Rejection Index (WRI) to monitor trucking capacity in the freight market and the impact rejections have on shipping rates.
Read on to learn what the WRI is, how it provides an ongoing outlook on trucking capacity availability, and how each freight market participant uses the WRI.
What is the Weighted Rejection Index (WRI)?
The WRI combines outbound tender market share (OTMS) and the weekly change in tender rejection rates (OTRIW). The purpose of WRI is to quickly identify where rejections are having the largest impact by valuing rejection rate changes in larger markets more than smaller markets.
OTMS x OTRIW = WRI
For example Atlanta’s OTMS value is 4% and outbound rejections increased from 3% to 5% over the past seven days. The calculation would be:
4 x (5-3) = 8 WRI
Alternatively, the smaller Jackson, Mississippi market has an OTMS value of 0.30% and rejection rates have fallen over the past week – 0.38 percentage points. WRI.JAN = .30 x -.38 = -.114
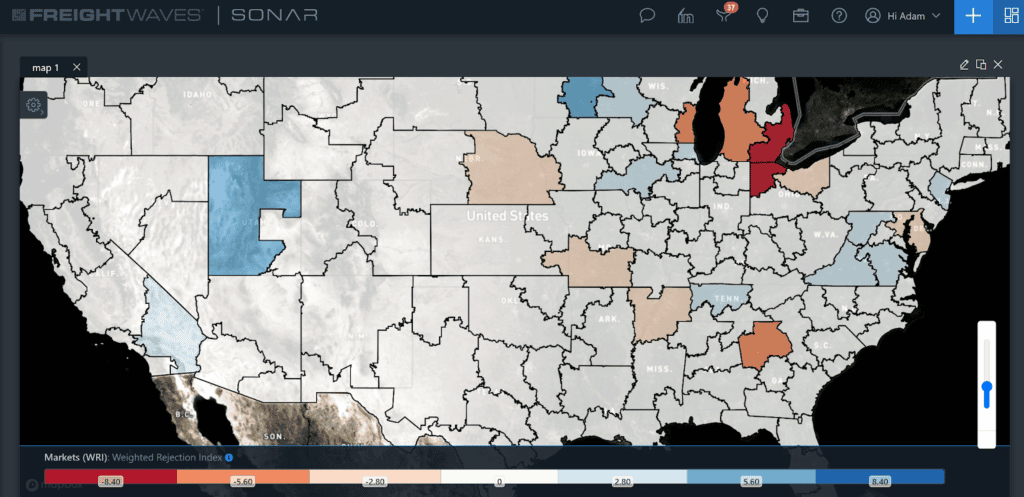
The easiest way to use this index is in a map or watchlist.
In the screenshot above, you can see that the Detroit and eastern Michigan area are seeing marked weekly changes in rejections, as the markets are shaded in red. A bluer shading would indicate a more favorable change (in the shipper’s favor) in rejections.
What does WRI say about capacity and shipping rates?
Using WRI maps and watchlists helps pinpoint the most significant changes in capacity each day, which can provide an outlook on what shipping rates to expect in various markets. Larger markets with tightening capacity will be valued more than smaller markets, making it easier to identify where to focus attention each day either as a broker, shipper or carrier. For example, if there is a darker red shading, you can expect that the shipping rates for space in a truck will also elevate on a cost per mile basis. In essence, the WRI allows you to view which markets’ capacity changes (and shipping rates) impact the largest amount of freight each day.
How does each market participant use WRI?
Various market participants in the freight industry can rely on the WRI heatmaps in different use cases. Beyond understanding how tight or loose various markets across the United States are regarding capacity and shipping rates, WRI helps the following freight market participants with these use cases:
Carriers: Carriers can use the WRI to quickly see which markets are having the most significant changes in capacity on a daily basis. Identifying capacity shifts allows carriers to adjust spot market pricing faster than before so they can ensure they are maximizing shipping rates to align to the market.
Brokers: Brokers can utilize the WRI in a similar manner to carriers – identifying which markets have the most significant changes in spot market pricing potential, but also to identify which markets need to be prioritized to find capacity on a daily basis.
Shippers: Shippers can use the WRI in a similar manner to brokers, using it to identify the markets most at risk for capacity failure on a daily basis, but additionally, which markets will have shipping rates that may impact the larger freight budget. By using the heatmap, shippers may want to consider other modes of shipping that are more cost-effective on a rate per mile basis.
Quickly understand capacity changes and impact on shipping rates daily with SONAR’s WRI
The freight market is not static; consumer habits, unforeseen market forces, and changing freight strategies add to complexity, resulting in more volatility. Freight market participants need tools at their fingertips to execute day-today with confidence amidst uncertainty. Gain more certainty with SONAR’s WRI to quickly see changes in capacity for every market and get a better sense of where shipping rates are headed in addition to how difficult (or easy) it will be to procure space for your freight loads.
FreightWaves SONAR is the fastest and most comprehensive freight market data and analytics platform in the world. There are 150,000+ unique indices available to SONAR subscribers. Not a FreightWaves SONAR user yet? Sign up for a demo here or by clicking the button below.