SONAR 7.0 featured the release of our highly anticipated Ocean Shipments Report App. This is one of the best leading indicators ever brought to market for the ocean container industry as well as for anyone involved in the domestic US port, intermodal, or trucking markets.
What does the ocean shipments report do?
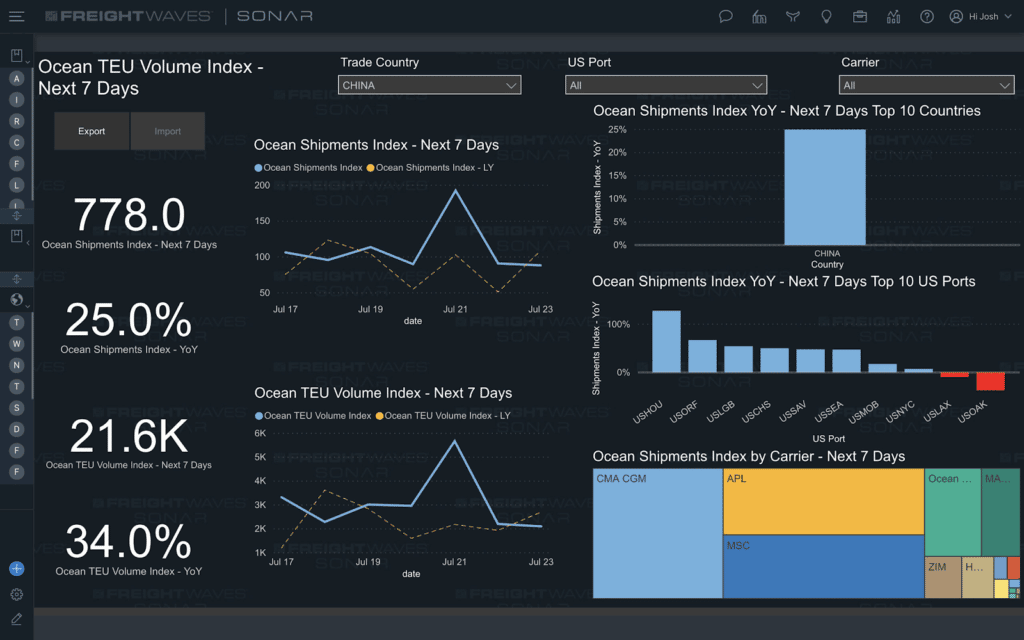
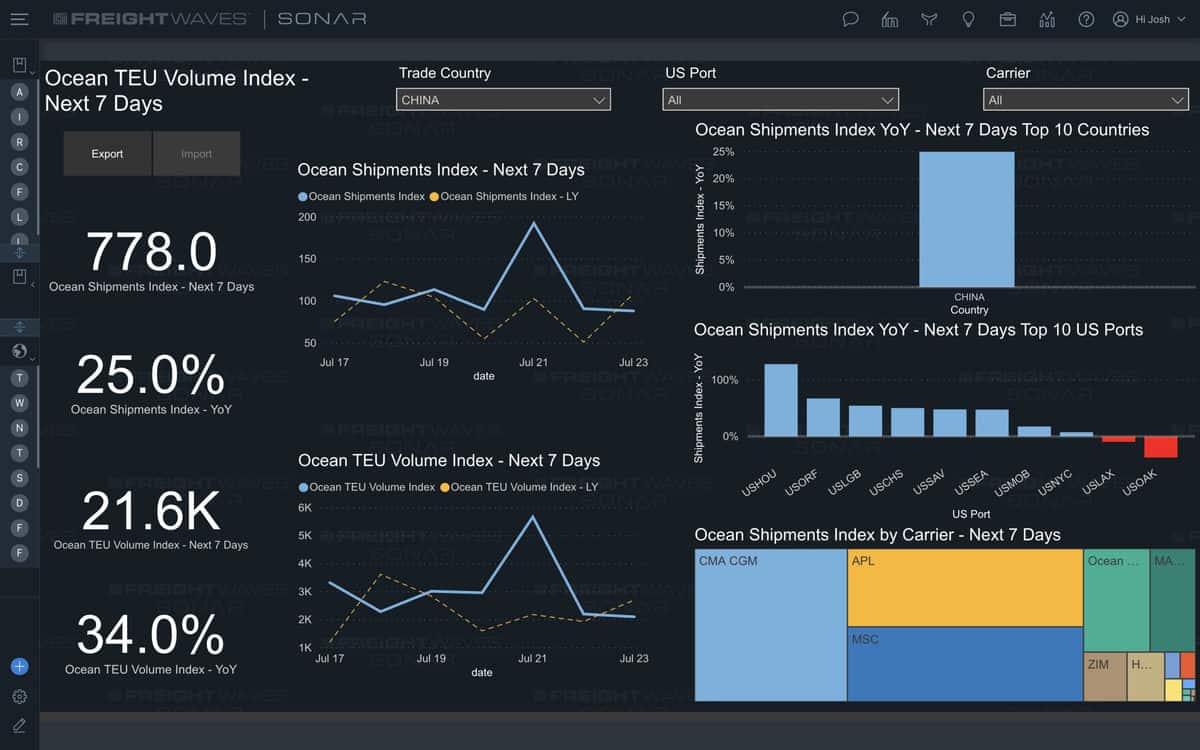
The ocean shipment report enables you to view ocean container volumes 7 days into the future on both containerized US imports and exports. The date is based on the date that the volumes are set to leave the country of origin. If you are looking at US imports, then those would be the foreign countries abroad (i.e. China, India, Vietnam). However, if you are looking at exports, then the dates would represent the volumes leaving those US ports for export to countries abroad.
The chart representing shipments has two lines; the solid blue line represents this year’s index, and the dotted, yellow line represents last year’s index. Shipments are classified and counted as the total number of bills of lading moving in the next 7 days. Keep in mind that this is the total amount of shipments, but that there can be multiple containers per shipment.
For that reason, we have another chart showing pure container volumes measured in twenty-foot equivalent units (TEUs). This represents the total number of containers being moved in the lowest common denominator, which is a twenty-foot container. So, if all container volumes moving were in twenty-foot containers, this is the total volume that the amount of containers would represent. For instance, let’s say that there were 5 x 40’ containers and 6 x 20’ containers moving on one shipment, then that 5 x 40’ containers would represent 10 TEUs (5 x 2 TEUs per 40’ container) and the 6 x 20’ containers would represent 6 TEUs (6 x 1 TEU per 20’ container). So, for this one shipment counted in the ocean shipment index, there would be 16 total TEUs counted in the TEU index. That is the reason it is important to show both metrics, but also the reason why the two do not always reflect the same exact directional changes/movement.
You can filter the report 3 different ways within the imports or exports visuals. The first filter reflects the country that the US volumes are coming from (for US imports) or going to (for US exports). So, if you filter down to a specific country then you will be seeing the next 7 days of volume flowing between that country and the US. For example, if you have your filter set to China, and the greater report filter set to imports, then you will be viewing the volumes leaving China in the next 7 days destined for the US. Then, by utilizing the two lines (this year’s volumes vs. last year’s volumes) you can determine where volumes are headed this year in comparison to last year.
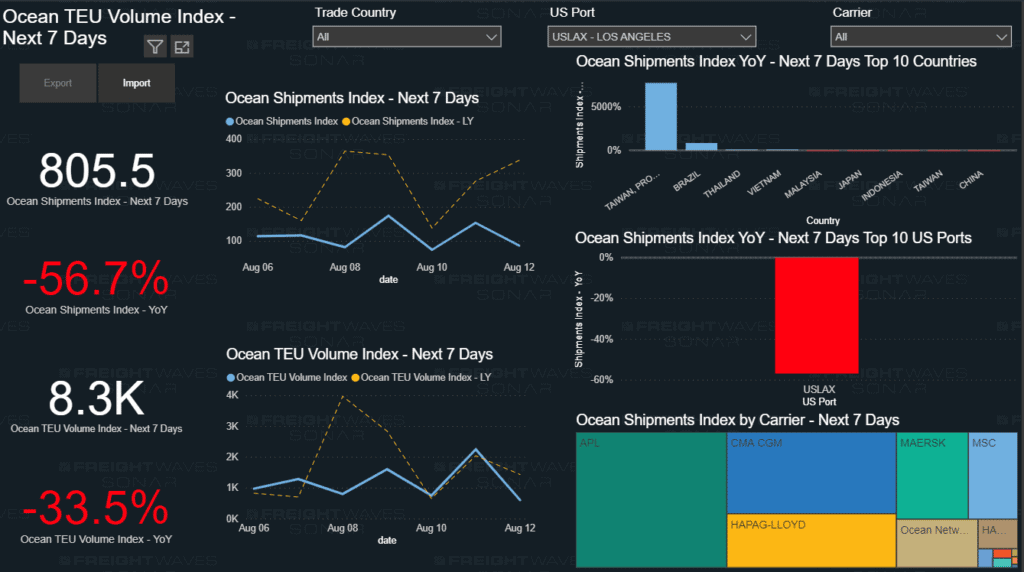
The next filter is for the specific US port. This enables you to view US port level specifics for both US imports and exports. For example, if you have set your filter to the Port of Los Angeles, then you will be seeing the ocean container volumes that are destined for the Port of Los Angeles before they ever leave those foreign countries. Thus, giving you a 14-30 day head-up on how much volume you can be expecting to arrive into the Port of Los Angeles in 14-30 (days depend on the transit time of the ocean vessels from those foreign countries to the Port of Los Angeles.
Ocean shipments report shows by carrier volumes
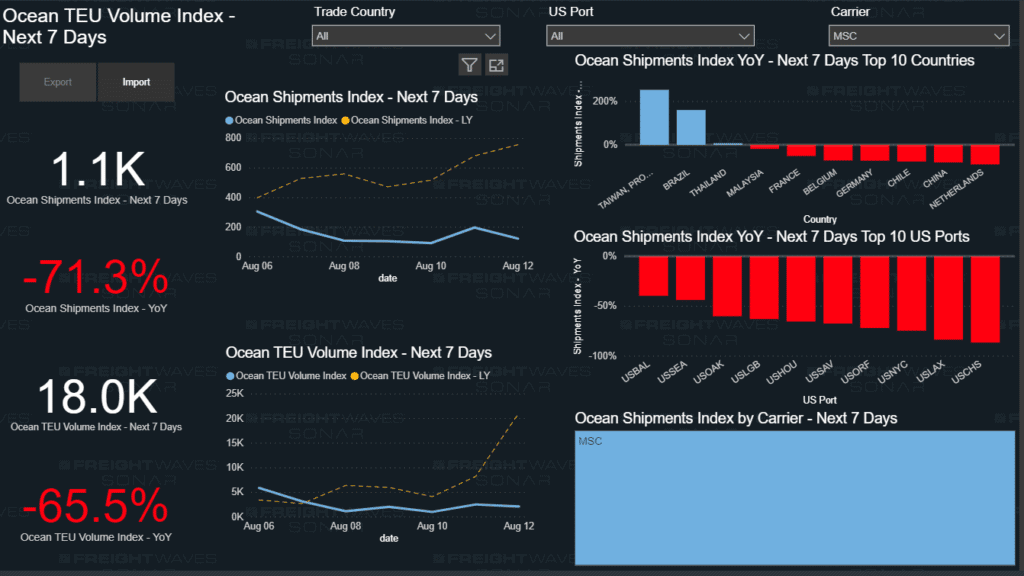
The Ocean Shipments Report also enables you to see which ocean carriers are being utilized the most across all of the volumes you see for the next 7 days which allows anyone involved in moving ocean container shipments on those lanes to see how volumes are shifting relative to demand for this year compared with demand for last year. If volumes this year are way above where they were last year, then you can expect capacity to be relatively tight on that specific trade lane, and ocean rates are likely to go up. Conversely, if demand is down compared to last year, then you can expect that freight capacity is in a state of oversupply, and should be putting downward pressure on rates. Thus, giving you advance lead time on when you can be expecting carriers to react to periods of depressed demand through the announcement of blanka sailings (capacity cutting measure where ocean carriers remove a vessel from a scheduled rotation, or just skip on port within that specific vessel rotation; thus, decreasing the amount of available capacity).