Widespread uncertainty continues to define global trade. Shippers, carriers, brokers and third-party logistics providers (3PLs) need to understand how current market conditions influence ocean rates, sailings and capacity. Failure to plan for ocean freight will inevitably lead to problems managing and securing freight, resulting in massive inventory problems ahead of peak season. With that in mind, a comprehensive Ocean Shipments Report, available in FreightWaves SONAR, can provide better ocean freight understanding and management. 

Ocean-Freight-Data_section 1

What does an ocean freight data shipments report reveal?

Collecting ocean freight data is based on twenty-foot equivalent units (TEUs), including the summation of less-than-container load (LCL) and full container loads (CL) volumes, and carrier breakdown. Within SONAR, users see the following key metrics within the Ocean Shipments Report:

  1. Ocean Shipments Index – This index reveals the import or export views for total projected ocean shipments over the next seven days.
  2. Ocean Shipments Index YOY – This index provides insight into the total ocean shipment index compared to the prior year across all carriers, origin, and other freight market participants.
  3. Ocean TEU Volume Index – This metric shows the total volume projection for the next seven days.
  4. Ocean TEU Volume Index YOY – This metric provides insight into how the current volume index compares to last year’s same reporting period. 
  5. Daily Breakdown of TEU Volumes to Expect vs. Historical Data – An included daily breakdown helps to visualize how freight will move through the coming week – critical for securing available sailings and recognizing when capacity will dip due to high volume. 
  6. Ocean Shipments Index YOY by Top 10 Countries – Global trade management means understanding how the top 10 countries’ ports are moving, showing expected volumes within a shipments index graph.
  7. Ocean Shipments Index YOY by Top U.S. Ports – This metric is critical for domestic freight management, showing the top U.S. port projects for the next seven days compared to the prior year’s time period. 
  8. Ocean Shipments Index by Carrier – This metric shows the breakdown of carriers involved in the current ocean freight projection for the next week, and the squares’ size indicates volume share in a Treemap-style graph.
Ocean-Freight-Data_section 2

How does ocean freight data in SONAR enable better freight management?

Using the Ocean Shipments Report helps to streamline ocean freight management, so users can:

  • Plan by Day. Drilling down into the daily expectations can help figure out which days are likely to coincide with sudden jumps in accessorials and surcharges. 
  • Plan by Country. Country-specific considerations, such as seeing the effects of tariffs, can be  determined by reviewing import and export volumes by country. 
  • Plan by Port. Port-specific planning allows for rapid views of top-performing ports for larger countries to reduce congestion at high-volume ports and plan accordingly. 
  • Plan by Carrier. Seeing carrier balance for a given port, country or another association provides a better basis for carriers to have available capacity due to lower volumes. 
  • Plan by Volume. Lower volume means one of two things – ample capacity or higher costs; still, higher prices may be acceptable when the alternative is an out-of-stock SKU in the warehouse. 
  • Plan by Comparing Ocean Shipment Data to Other SONAR Reports and Figures. Using Ocean Shipments Report data is only one part of the value; the remainder lies in considering how this data can augment the benefit of other data within SONAR, including Lane Scorecard and a user’s custom dashboard.

Users also can filter data from within the metric to isolate values for a specific trade country, U.S. port or carrier.

Ocean-Freight-Data_section 3

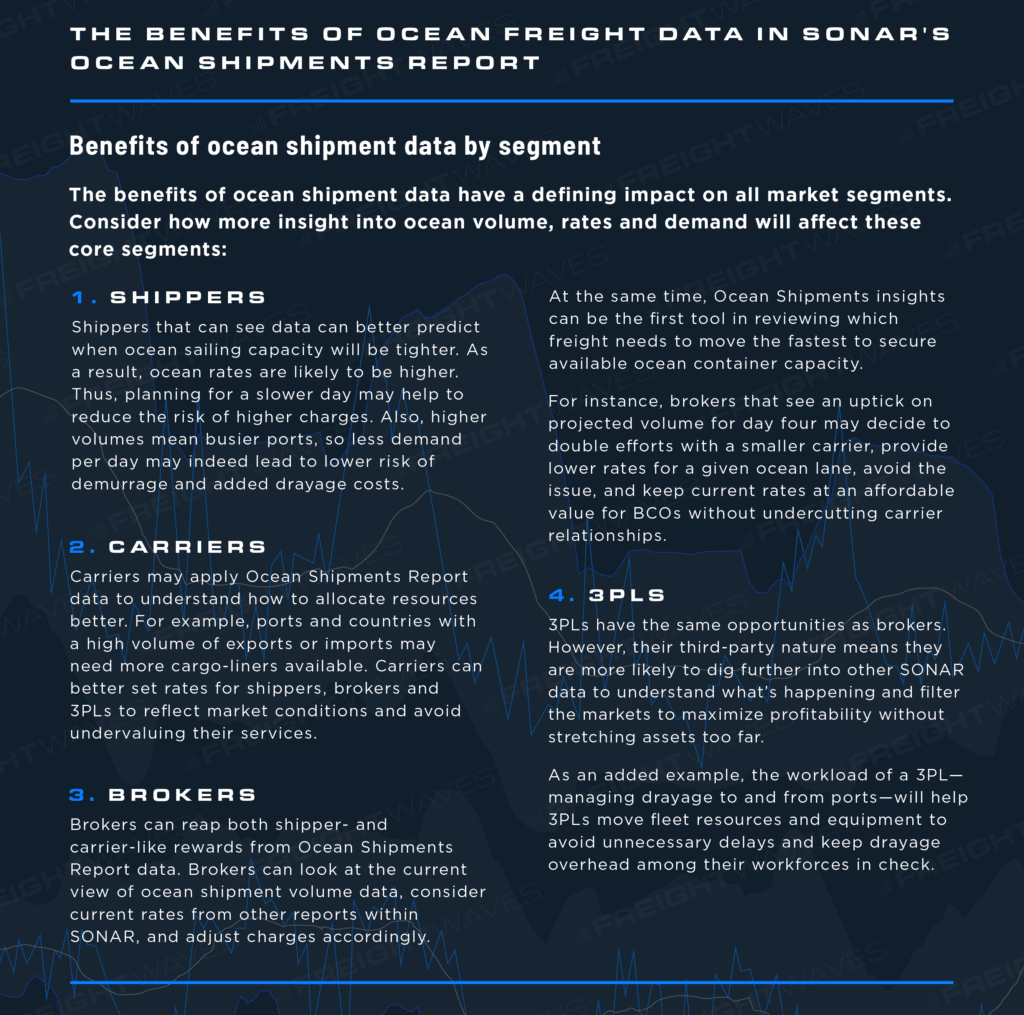
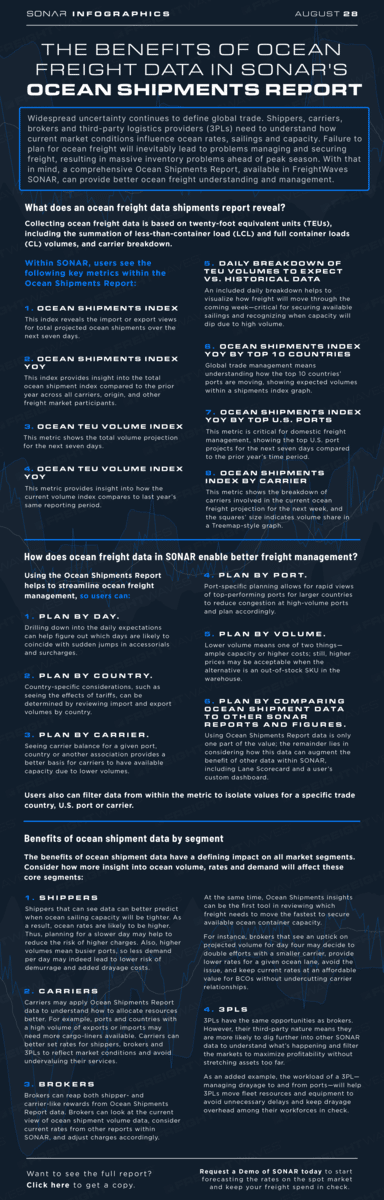
Benefits of ocean shipment data by segment

The benefits of ocean shipment data have a defining impact on all market segments. Consider how more insight into ocean volume, rates and demand will affect these core segments:

Shippers

Shippers that can see data can better predict when ocean sailing capacity will be tighter. As a result, ocean rates are likely to be higher. Thus, planning for a slower day may help to reduce the risk of higher charges. Also, higher volumes mean busier ports, so less demand per day may indeed lead to lower risk of demurrage and added drayage costs.

Carriers

Carriers may apply Ocean Shipments Report data to understand how to allocate resources better. For example, ports and countries with a high volume of exports or imports may need more cargo-liners available. Carriers can better set rates for shippers, brokers and 3PLs to reflect market conditions and avoid undervaluing their services. 

Brokers

Brokers can reap both shipper- and carrier-like rewards from Ocean Shipments Report data. Brokers can look at the current view of ocean shipment volume data, consider current rates from other reports within SONAR, and adjust charges accordingly. At the same time, Ocean Shipments insights can be the first tool in reviewing which freight needs to move the fastest to secure available ocean container capacity. 

For instance, brokers that see an uptick on projected volume for day four may decide to double efforts with a smaller carrier, provide lower rates for a given ocean lane, avoid the issue, and keep current rates at an affordable value for BCOs without undercutting carrier relationships.

3PLs

3PLs have the same opportunities as brokers. However, their third-party nature means they are more likely to dig further into other SONAR data to understand what’s happening and filter the markets to maximize profitability without stretching assets too far. 

As an added example, the workload of a 3PL – managing drayage to and from ports – will help 3PLs move fleet resources and equipment to avoid unnecessary delays and keep drayage overhead among their workforces in check. 

View the Full Infographic

Ocean-Freight-Data_full-graphic
White Papers
April 23, 2024

The State of Freight – April 2024

March 27, 2024

The State of Freight – March 2024

March 21, 2024

Take Demand Planning and Forecasting to the Next Level: An Introduction to Tender Data