Tracking the correct KPIs in supply chain processes across warehouses, logistics, transportation and freight management is essential. Leveraging new technologies and freight forecasting platforms make the best decisions possible for freight broker profit gains and net value across all segments. The capabilities of supply chains are continuously changing to reflect the latest advancements. As an example, Supply Chain Dive states, “Minimizing the number of claims for overages, shortages and damages (OS&Ds) as a percentage of deliveries,” is one way to manage operations and track performance better. While following OS&D helps, it’s only a fraction of the true value of data-driven supply chain management. And through new freight forecasting technologies, users are growing more informed and capable of responding to customers’ needs with these leading KPIs. View the following top KPIs in supply chain management and grab a handy full infographic, designed by Emily Ricks, at the end.
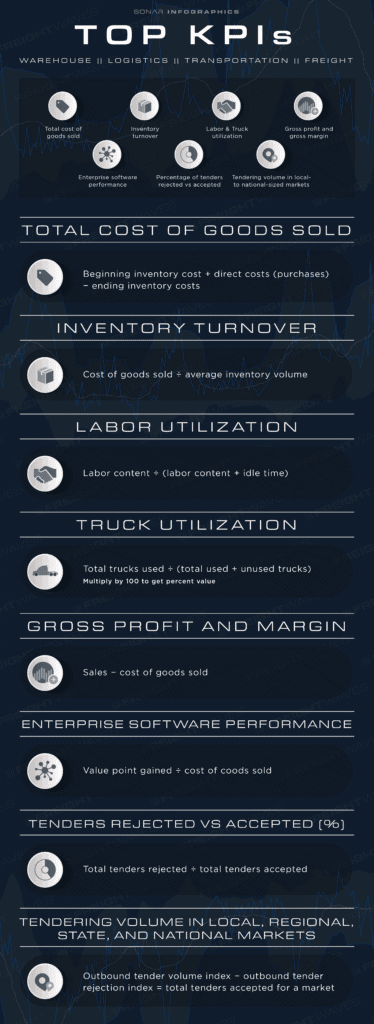
Total cost of goods sold
The total cost of goods sold is among the most prominent and most influential metrics in supply chain management. It is a measure of the beginning inventory cost plus the purchases made during the period, minus the ending inventory costs.
Beginning inventory cost + direct costs (purchases) for a duration – ending inventory costs
It’s also important to realize that purchases made during that period are related to the production, storage and shipping of the product – the hard, direct costs. And as one of the strongest KPIs in supply chain management, it’s critical to calculate several other metrics.
Inventory turnover
Inventory turnover rates simply provide insight into the total number of times a company’s inventory cycles throughout a year. It is calculated by dividing the cost of goods sold by the average inventory volume.
Cost of goods sold/average inventory volume = X
As the result increases, it indicates growth within the company and higher throughput, including replenishing and executing more loads.
Labor utilization
Average labor utilization is yet another of the top KPIs in supply chain management. It’s calculated by dividing the total labor content by the sum of labor content and total idle time.
If the total labor content amounts to 120 minutes, and if the total idle time is 30 minutes, the average labor utilization would be calculated as follows:
Labor content/ (labor content + idle time) = X
120 / 150 = 0.8.
Multiplying the result by 100 derives an 80% labor utilization rate. As the value increases, it indicates increased productivity among your workforce.
Truck utilization
Truck utilization is calculated similarly to labor utilization:
Total trucks used/(total trucks used + unused trucks) = X * 100 = X%
Gross profit and gross margin
Gross profit and margins are calculated by simply subtracting the cost of goods sold from sales.
Sales – cost of goods sold = X
Enterprise software performance
Measuring enterprise software performance is another one of the tricky KPIs in supply chain management. It’s largely dependent on how a company views software performance. For instance, is the software being used on all transactions, or does the software generate a more emphatic gross profit margin? Regardless, it’s a ratio of the total value gained from a software based on user view and preference divided by the costs of goods sold.
Value point gained/cost of coods sold = X
SONAR-powered comparison: Percentage of tenders rejected versus accepted
Tracking tenders rejected versus accepted is another easy one in the list of top KPIs in supply chain management. Its calculation is as follows:
Total tenders rejected/total tenders accepted = X
Since a company would really want to accept and service lines that are going to make the most profitability possible, seeing that metric for individual markets is essential. And that is a fundamental principle in supply chain management. Fortunately, SONAR makes it possible to benchmark in-house tendering acceptance rates against geographic-specific markets. For example, market-specific total tenders accepted is calculated through the following formula:
Outbound tender volume index – outbound tender rejection index = total tenders accepted for a market
SONAR-powered comparison: Tendering volume in local, regional, state and national markets
And another valuable insight is recognizing how a company stacks up in terms of total freight volumes tendered. FreightWaves SONAR OTVI and ITVI show the various volumes. And companies can divide their tendering volume by the SONAR volumes of tender to derive a percentage of accepted loads for a market that a broker or company possesses. In a sense, it helps to judge the market share of a given company.
Leverage the top KPIs in supply chain insights to add value regardless of segment
There are endless opportunities to expand insights into trucking and logistics management. Supply chain leaders need quantifiable and actionable metrics. That much is clear. Start by tracking the aforementioned KPIs in supply chain processes in-house. And embrace a next-level of transportation insight with SONAR-fueled data. Request a SONAR demo online to learn more.