Much of the debate over freight analytics rests on how well predictive analytics aligned with what was observed in the market. That’s the crux of predictive analytics in any industry. It’s comparable to projected costs versus observed costs. As explained by the Small Business Chronicle, “Projected costs are based on prior sales numbers and anticipated increases in expenses. [Observed] costs result when money is actually spent on the various supplies, services and other expense categories used by the business.” But that concept often falls by the wayside in supply chain analytics, especially when assessing the accuracy of predictions using freight data or a forecasting engine. However, that’s changing with the release of new FreightWaves SONAR Van Current Day Rate (FWS) and reefer (FWSR) indices, the FreightWaves Scientific National Truckload Rates Per Mile indices, which present the Lane Signal data predictions in a ticker format for faster review and application.
- FWS.USA or FWSR.USA
- FWS7.USA FWSR7.USA
- FWS28.USA or FWSR28.USA
- FWSW.USA
But before explaining these new index implications, let’s first consider the reality of analytics platforms and their algorithmic alignment between projections and outcomes.
Why analytics platforms that offer prediction now need to go further to check their work
A problem is brewing as more analytics platforms offer predictive insights. As analytics platforms use machine learning to aid in deriving predictive insights, increasingly it’s vital that these platforms have a mechanism in place to check the accuracy of those predictions. Predictive insights take massive amounts of data from market conditions and yield a potential outcome of what is likely to occur.
While that is a fundamentally sound principle, it can quickly lack value if those insights do not pan out into reality. Effective transportation procurement depends on having an outlook to cost exposure, and analytics platforms need to ensure their predictions offer up accurate freight rate projections, measuring how well they align with the final, observed rate per mile. After all, wide deviations within predictive freight rates can still add up to big trucking revenue changes over a week, month or year. Instead, knowing how well those truckload rates stack up is critical to maximizing their use and pricing or buying strategies.
Tendered data rates of today compared to those predicted in the past
The value of FreightWaves SONAR lies in its use of tendered data to derive meaningful, actionable insights. The tender data rates of today, as found within Lane Signal, provide plenty of insight into what is likely to happen for each lane. Remember that the Lane Signal app contains views into 780,000+ lanes across the country. Shippers, brokers, and carriers who manage millions in truckload freight depend on Lane Signal to evaluate market activity in hundreds of daily shipments by looking at origin and destination pairs to see how hard a load is to cover and the potential prediction of rates per mile 1 day, 1 week, 1 month, 3 months, 6 months, and one year out. But what about those other organizations that want a true market-wide view and need a way to gauge the accuracy of truckload rates per mile they saw within Lane Signal itself?
For example, if ocean shipping imports surge, how will that affect the overall state of predicted truckload rates. The only way to really know is to measure all predicted Lane Signal data manually and see how it compares to today’s observed rates. That is where the FreightWaves Scientific National Rates Per Mile Indices come into play.
The proprietary algorithm that powers Lane Signal works within the new FreightWaves Scientific Rates Per Mile Indices as follows:
- FWS.USA – This is a national scientific van rate with a 28-day prediction that continuously changes based on the most recent day’s close tendered data.
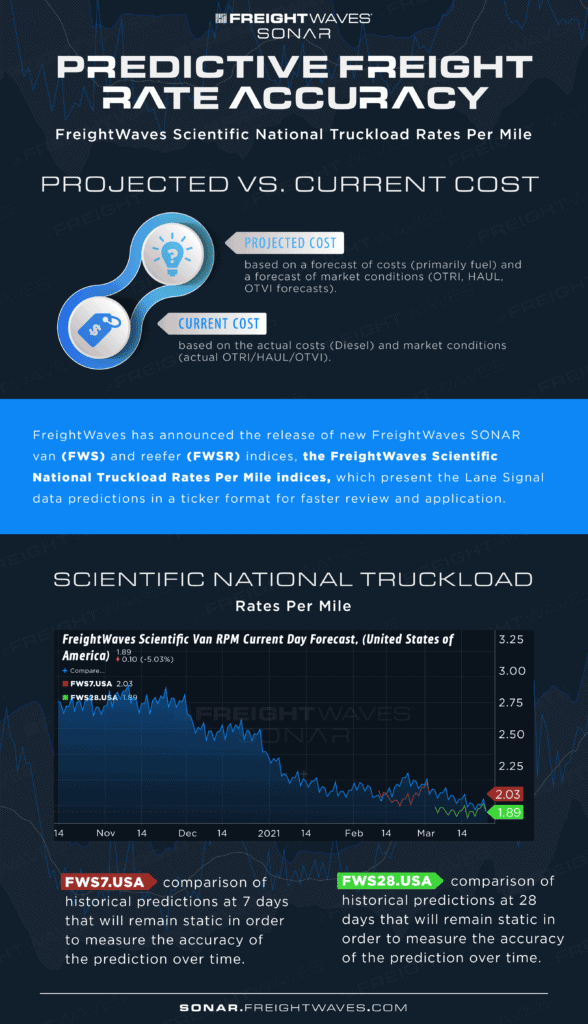
- FWS7.USA – Comparison of historical predictions at 7 days that will remain static in order to measure the accuracy of the prediction over time.
- FWS28.USA – Comparison of historical predictions at 28 days that will remain static in order to measure the accuracy of the prediction over time.
- FWSW.USA – The final aspect of this new index is a weighted average of the rates, based on volume tender data and assesses the validity of such data. Lanes with higher volumes are valued higher in this particular form than those with lower volumes.
Freight management parties can find comparable indices for reefer truckload rates by accessing FWSR.USA, FWSR7.USA and FWSR28.USA respectively, allowing both shippers and carriers to stay strategic with managing logistics.