According to Goldman Sachs and SJ Consulting, the total North American trucking market generates $780 billion annually. Of this $780 billion, $360 billion is derived from for-hire full truckload, with most of the balance ($355 billion) from private fleets and the remainder ($65 billion) from less-than-truckload (LTL) carriers.
Therefore, if we attempt to size the contract market, we must multiply the for-hire, full truckload market of $360 billion times the current contract market penetration rate of 80%. Running through this math suggests the trucking contract market in the U.S. is about $288 billion today ($360 billion x 80% contract market penetration = $288 billion).
The 80% figure is FreightWaves’ best estimate for the aggregate, average contract market exposure for all fleets in the U.S. based on our own experience, anecdotal evidence and numerous surveys we have conducted. Larger carriers tend to have more contract exposure, while smaller fleets generally have less – though the mix changes for both throughout the cycle.
On average and over the medium- to long-term, the contract market should continue to grow at 3-4% annually, more or less inline with nominal GDP growth in the U.S. We believe that the spot market should grow faster (at approximately 7% annually) due to increasing capital flooding into the brokerage market, increasing competition and increasing digitization of the industry. This means that the contract freight mix could decrease to 76% in five years (by 2025) from 80% today but the value of overall contract freight would still grow to $342 billion (from $288 billion today). There is an inherent ceiling on the overall size of the spot market because most carriers and shippers prefer a direct relationship based on rolling contract rates to ensure non-volatile pricing and adequate capacity. And, given the heavy fixed costs of running a trucking company, for a carrier it is better to have peace of mind that you will be able to keep your trucks moving with steady freight while shippers do not want to lose access to capacity.
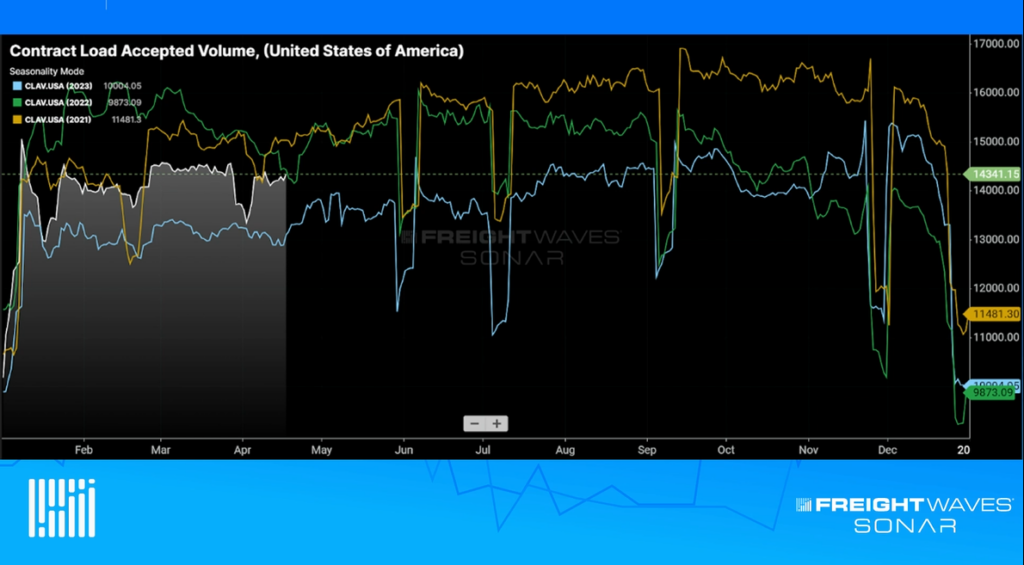
There are two primary determinants of the size of the contract market – contracted load volumes and contracted rates.
- Contracted load volumes go up in a bull market for trucking but can also often grow slower than spot market loads in a bullish market because carriers are increasingly rejecting contracted freight in favor of higher paying spot market loads (and vice versa). This is not always the case, however. As the bull market of 2018 initially took off, contracted loads were actually growing faster than spot market loads because shippers were willing to renew at 10% or higher rates just to secure adequate capacity and avoid paying skyrocketing spot rates. So there are certainly exceptions and the market is dynamic; whether more volume incrementally flows to the contract or spot market depends on participants’ expectations for the sustainably of the spot market pricing moves.
- Contract rates are often referred to as “paper” rates because they are not official or legally binding contracts, and instead are simply paper agreements between a shipper and a carrier or a shipper and a broker. Contract rates do not guarantee minimum volume for carriers at the contracted rate. For example, even if a carrier is able to push through a price increase in its contracted rates, if the carrier is downgraded in the shipper’s routing guide, it may not receive equivalent revenue despite the increasing rates due to falling load volumes.
Nevertheless, the contract market is the largest part of the freight market because it is supposed to act as a stabilizing force on the volatility of the trucking industry. If a carrier lived and died by the spot market for all of its business, it would not be long before it went out of business due to the inherent high volatility of spot rates (as they are based on pure supply and demand today). Contract rates do not offer fail-safe protection for carriers; however, even though they are less volatile, they are only good for as long as the spot market does not move too far away. On average, contract rates are rebid every three to six months to market (i.e. closer to where spot market rates are). The length of contracted rates gets shorter as spot market volatility increases.
Contract rates are influenced by spot rates because the near-term movement in spot rates sets the direction and level of future contract rates. If spot rates are rising and above contract rates, there will be upward pressure on future contract rates at the next negotiated renewal. Conversely, if spot rates are falling and below contract rates, the reverse will be true.
While the 80%/20% mix of contract and spot freight for the average carrier is true, that is simply the average across the cycle. We have found that this mix shifts dynamically for carriers throughout the cycle depending on their negotiating leverage and their fleet size. Publicly traded truckload companies tend to run higher average contract mix (generally 90% or more), compared to 80% or less for small to midsize carriers. This is because smaller carriers often have a steady base of contract customers in their home markets (or region) but must use brokers for backhauls when venturing outside of their traditional lanes and geographies.
In markets with high and rising spot rates, the average contract to spot mix shifts to closer to 70%/30% according to our research. This is due to carriers taking advantage of higher rates in the spot market and increasingly rejecting contracted freight at the now inferior, legacy contract rates. This increases both spot market rates and spot market activity. Therefore, the contract market still grows in a bull market for trucking (but often less than the spot market) and outperforms the spot market in a bear market for trucking. The contract market is structurally growing alongside increasing freight volumes in the U.S., but the percentage mix attributable to contract freight is slowly falling due to faster growth in spot market freight.
If you are interested in tracking the freight market, including contract and spot rates, FreightWaves SONAR offers over 150,000 indices, most of which are updated daily. The world’s fastest, most accurate freight data includes trucking spot rate indices, tender indices, and market balance indices. SONAR freight tender indices are created based on actual electronic load requests from shippers to carriers, meaning you know that the index is measuring an actual load transaction.
SONAR offers proprietary data that comes from actual load tenders, electronic logging devices and transportation management systems, along with dozens of third-party global freight and logistics-related index providers like TCA Benchmarking, Freightos, ACT, Drewry and DTN.
SONAR offers the fastest freight market data in the world, across all major modes of traffic. The SONAR platform is the only freight forecasting and analytics platform that offers real-time freight market intelligence driven off actual freight contract tenders. Find out more about FreightWaves SONAR.


