

Over time, rates can become misaligned with market conditions, either because of lack of maintenance or inability to gauge how the market has changed. Now, SONAR Supply Chain Intelligence (SCI) subscribers can take a more active and targeted approach in managing how they spend their money or gain validation for their decisions.
FreightWaves has made it even easier to identify where shippers’ biggest market opportunities exist by adding two new views to its SONAR SCI platform.
The primary purposes of these views are the following:
The two main data sources used in generating these outputs are: FreightWaves’ tender data, which measures compliance and capacity conditions; and invoice data, which is used for benchmarking in over 700,000 lanes.
These new views also come with added visualization tools to help SCI subscribers gain a faster understanding of what their freight patterns look like and to draw attention to the lanes in which the greatest cost-saving or risk avoidance opportunities exist.
SUMMARY VIEW
The Summary View is divided into three sections. The top line simply sums the potential freight spend, load count, miles and carbon footprint. This allows an SCI subscriber to make sure the data is in line with what is expected.
The second section summarizes the total freight spend risks and opportunities. The overpayment box is a sum of the freight spend (load count x miles x subscriber-provided benchmark rate) in those lanes in which shippers have relatively favorable capacity conditions but are paying more than the market average rate. The market rate is based on FreightWaves’ database of nearly $100 billion of settled contract invoices from the past four and a half years.
The third section is data visualizations. The map shows an SCI subscriber’s freight network or shipping patterns, while the other visual tool is an interactive distribution map showing the subscriber how much of the freight spend is above or below market.
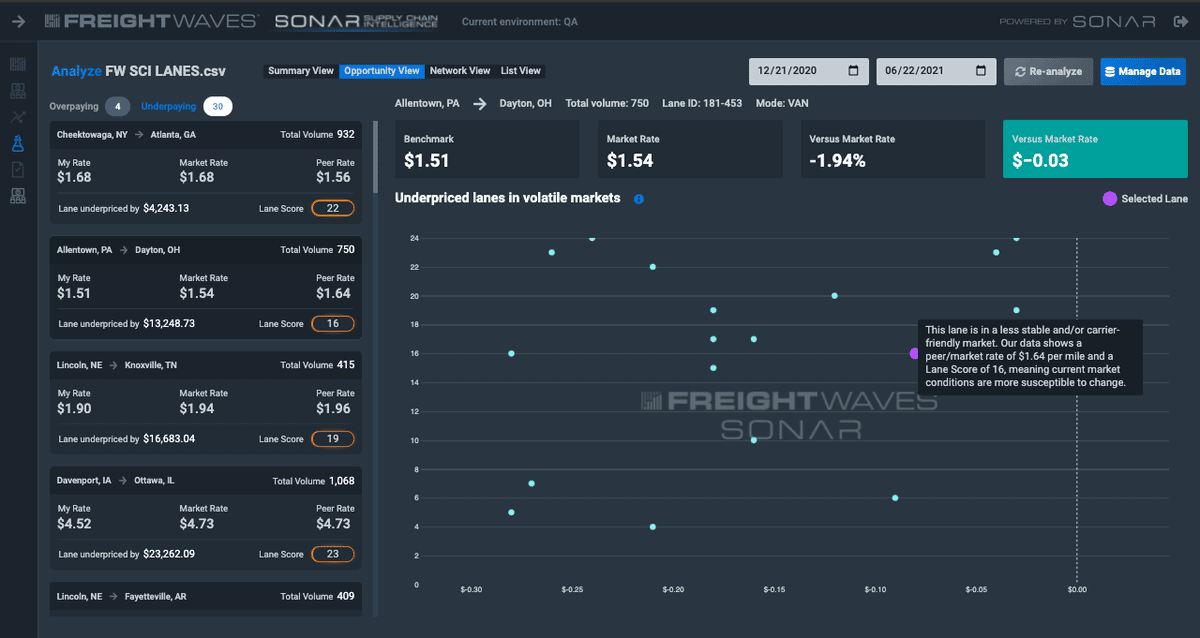
The Opportunity View allows a SONAR SCI subscriber to see the “low-hanging fruit” with more granularity.


