COVID-19 triggered a six-year growth rate in six months within e-commerce and stimulated the supply chain. Now, carriers, brokers and 3PLs are trying to keep up, stay ahead and plan for peak season—all at the same time. Peak season is on track to break records as well, especially if growth continues at current levels. The reopening of the economy did little good to force a rebound of shipping volumes. May 2020 volumes were 23.6% lower than May 2019, and the major indices created by FreightWaves have seen significant declines compared to last year. Then came the July 4th holiday, which saw a sharp increase in freight volumes and continued those strong volumes with the SONAR Outbound Tender Volume Index showing volumes 30% higher than 2019. For shippers, brokers and carriers alike, the market isn’t entirely certain. But for those that look to leverage freight metrics and data to understand lane trends, FreightWaves’ SONAR now includes a remarkable innovation—the Lane Scorecard

What is the Lane Scorecard?

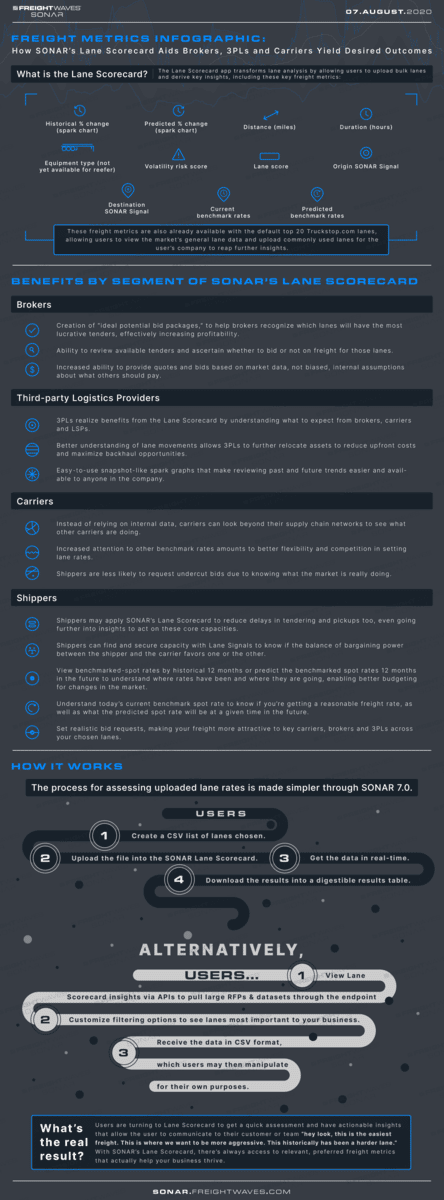
The Lane Scorecard app transforms lane analysis by allowing users to upload bulk lanes and derive key insights, including these key freight metrics:

  • Historical % change (spark chart)
  • Predicted % change (spark chart)
  • Distance (miles) 
  • Duration (hours)
  • Equipment type (not yet available for reefer)
  • Volatility risk score
  • Lane score 
  • Origin SONAR Signal
  • Destination SONAR Signal
  • Current benchmark rate 
  • Predicted benchmark rate 


What SONAR’s Lane Scorecard App Provides

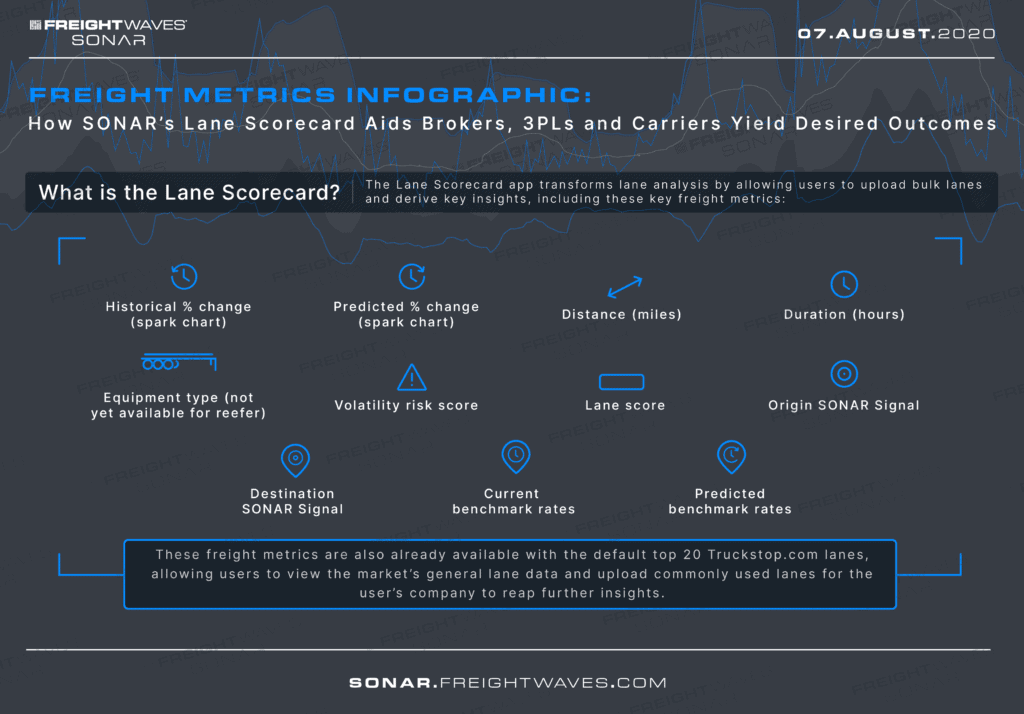
These freight metrics are also already available with the default top 20 Truckstop.com lanes, allowing users to view the market’s general lane data and upload commonly used lanes for the user’s company to reap further insights.

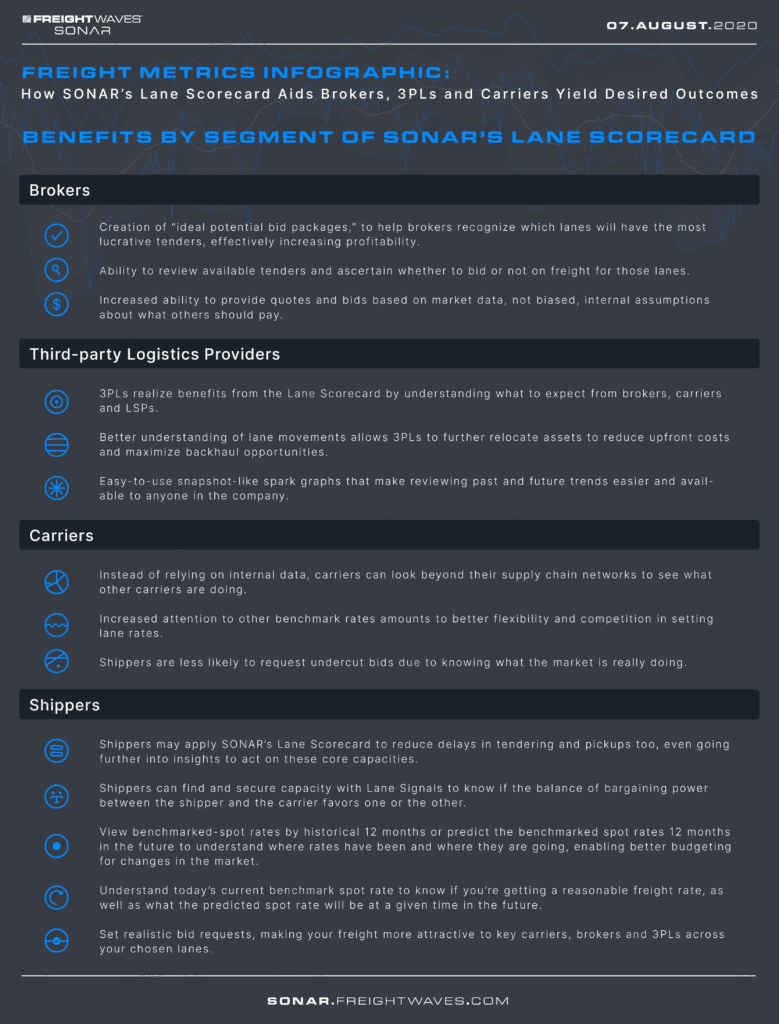
How the Freight & Logistics Industry Players Benefit from the Freight Metrics in SONAR’s Lane Scorecard

SONAR-LaneScore-Card_2of3

BROKERS

  • Creation of “ideal potential bid packages,” to help brokers recognize which lanes will have the most lucrative tenders, effectively increasing profitability. 
  • Ability to review available tenders and ascertain whether to bid or not on freight for those lanes. 
  • Increased ability to provide quotes and bids based on market data, not biased, internal assumptions about what others should pay. 

THIRD-PARTY LOGISTICS PROVIDERS

  • 3PLs realize benefits from the Lane Scorecard by understanding what to expect from brokers, carriers and LSPs. 
  • Better understanding of lane movements allows 3PLs to further relocate assets to reduce upfront costs and maximize backhaul opportunities.
  • Easy-to-use snapshot-like spark graphs that make reviewing past and future trends easier and available to anyone in the company. 

CARRIERS

  • Instead of relying on internal freight data, carriers can look beyond their supply chain networks to see what other carriers are doing. 
  • Increased attention to other carrier rates amounts to better flexibility and competition in setting lane rates. 
  • Shippers are less likely to request undercut bids due to knowing what the market is really doing. 
  • Access to leading freight metrics that are custom-filtered to carrier preferences, reducing clutter and speeding decision-making.

SHIPPERS

  • Shippers may apply SONAR’s Lane Scorecard to reduce delays in tendering and pickups too, even going further into insights to act on these core capacities. 
  • Shippers can find and secure capacity with Lane Signals to know if the balance of bargaining power between the shipper and the carrier favors one or the other. 
  • View benchmarked-spot rates by historical 12 months or predict the benchmarked spot rates 12 months in the future to understand where rates have been and where they are going, enabling better budgeting for changes in the market. 
  • Understand today’s current benchmark spot rate to know if you’re getting a reasonable freight rate, as well as what the predicted spot rate will be at a given time in the future.
  • Set realistic bid requests, making your freight more attractive to key carriers, brokers and 3PLs across your chosen lanes and gain “Shipper of Choice” status. 

HOW LANE SCORECARD WORKS

The process for assessing uploaded lane rates is made simpler through SONAR 7.0.

Users…

  1. Create a CSV list of lanes chosen. 
  2. Upload the file into the SONAR Lane Scorecard. 
  3. Get the data in real-time.
  4. Download the results into a digestible results table.

Alternatively, users…

  • View Lane Scorecard insights via APIs to pull large RFPs & datasets through the endpoint
  • Customize filtering options to see lanes most important to your business.
  • Receive the data in CSV format, which users may then manipulate for their own purposes.

What’s the real result?

Users are turning to Lane Scorecard to get a quick assessment and have actionable insights that allow the user to communicate to their customer or team “hey look, this is the easiest freight. This is where we want to be more aggressive. This historically has been a harder lane.” With SONAR’s Lane Scorecard, there’s always access to relevant, preferred freight metrics that actually help your business thrive. 

VIEW THE FULL LANE SCORECARD INFOGRAPHIC BELOW

*Click to see the large version and save.

White Papers
March 27, 2024

The State of Freight – March 2024

March 21, 2024

Take Demand Planning and Forecasting to the Next Level: An Introduction to Tender Data

February 6, 2024

Asleep at the Wheel: Shippers and the Freight Market Outlook for 2024