Risk management is important to any kind of investment. One of the best strategies of risk management is diversification of assets or revenue drivers. Brokerage leaders are turning to this strategy for their freight business.
Many small and medium-sized brokerages find themselves entering the freight brokerage market with a specialized niche. You have a relative who owns a produce company or a friend started a new beverage line, and you enter the brokerage business to advise their transportation needs.
As your revenue begins to grow, you start to notice that product is cyclical. When those markets produce less, you bring in less revenue, and when those markets do well, you do well. While it is possible to continue revenue growth, you work extremely hard during down periods in your freight business just to remain stable.
This is why diversifying your freight business portfolio is so important. Your goal in this revenue strategy is to smooth out unsystematic risk, so segments of your business can perform negatively while top performers continue to drive revenue growth.
You see examples of this strategy in large brokerages today.
Examples of portfolio diversity in the freight business
XPO Logistics strategy has attacked diversity harder in the last few years. After losing Amazon’s $600 million annual spend in 2019, Bradley Jacobs, the chief executive officer of the company, vowed to diversify the freight business portfolio so that no single customer was more than two percent of revenue.
CH Robinson has stuck to this same two percent strategy in recent years, along with its market verticals. In 2019, not one of their market shares was over 20 percent of their total revenue. It implements this strategy into its carrier markets (small, medium and large) and its transportation segments (truckload, LTL, global forwarding, etc) to balance the routine ebbs and flows of the freight market.
Diversification is not just about protecting yourself from market downturns. This process can prepare your brokerage for surprising market upswings as we see in port freight demand.
The increase in port freight demand
Port congestion is at its peak, freight brokerages who have spent time developing strong relationships with drayage companies, container haulers and truckload freight carriers will be able to continue to hold their margin while spot market brokers will have a difficult time keeping rates down.
If you are a freight brokerage business that has missed the opportunity to prepare for the increase in port transportation demand, do not take this as a loss, but a learning lesson. Thankfully, you have entered an industry that is very cyclical and there will be other opportunities you can prepare now.
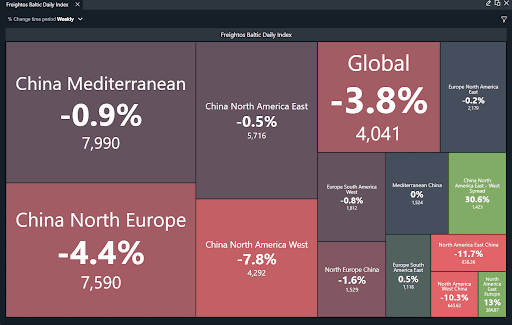
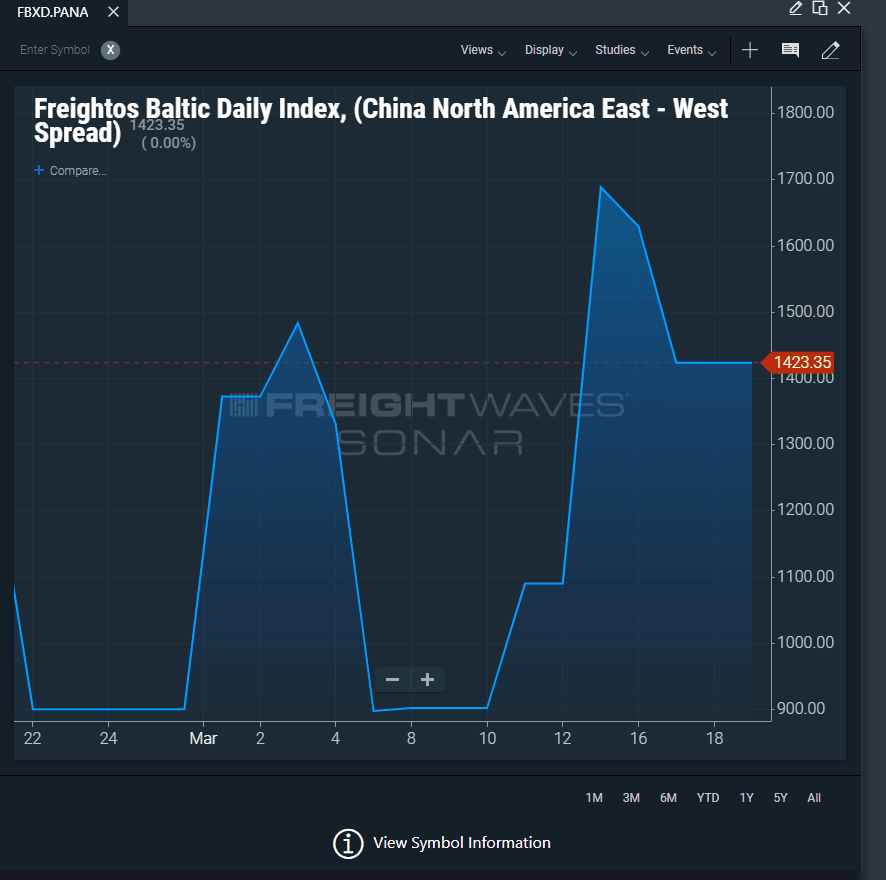
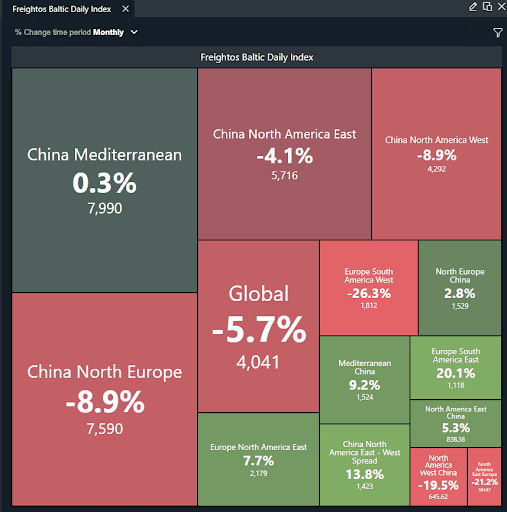
SONAR has the tools for you to watch for market indicators that will help you decide where and when to attack these international shipments. Using SONAR tickers, PIMS, CSTM and FBXD, you will be able to guide your sales teams to diversify your freight business portfolio for long-term, stable growth.
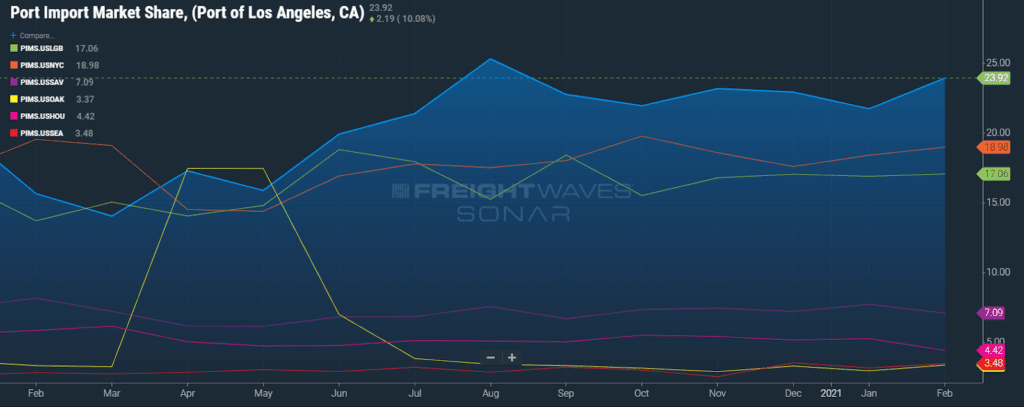
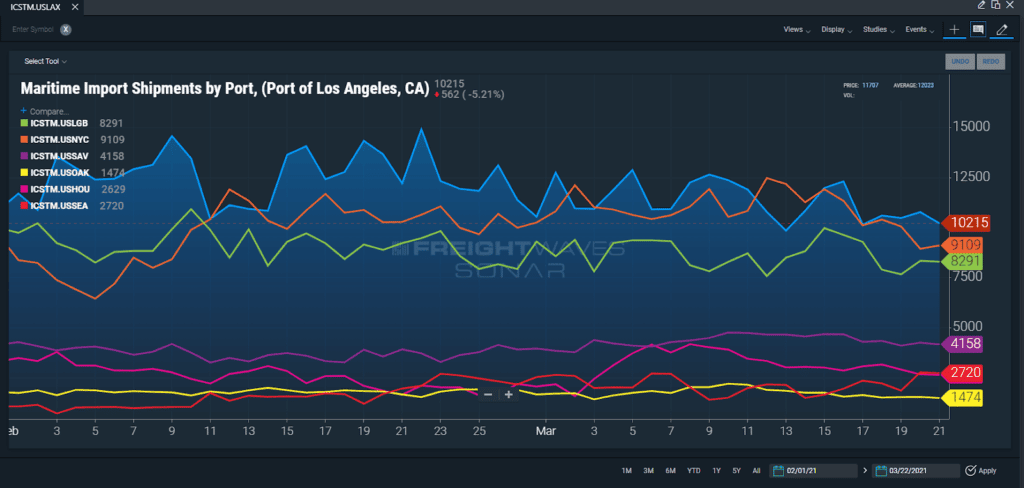
SONAR Port Import Market Share (PIMS)
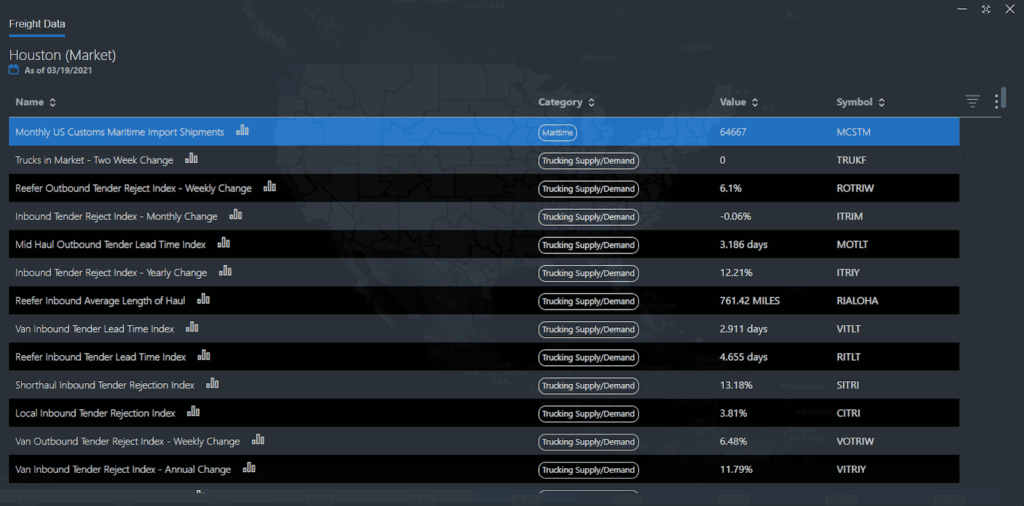
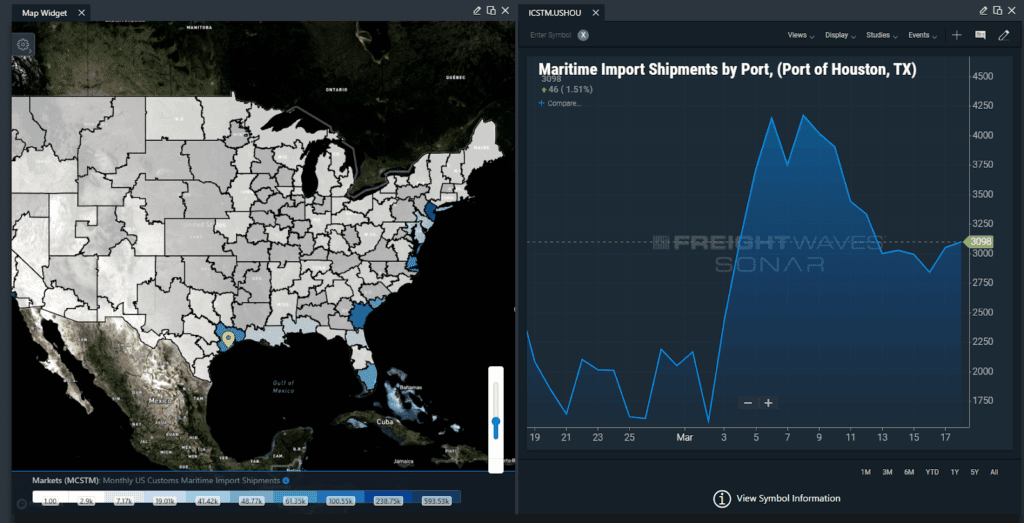
The SONAR Port Import Market Share (PIMS) captures the market share of the total U.S. Customs Maritime Import Shipments on a monthly basis. It consists of imports cleared through customs each month and what market share specific port of entries hold. This data can show you how importers are choosing to route their shipments.