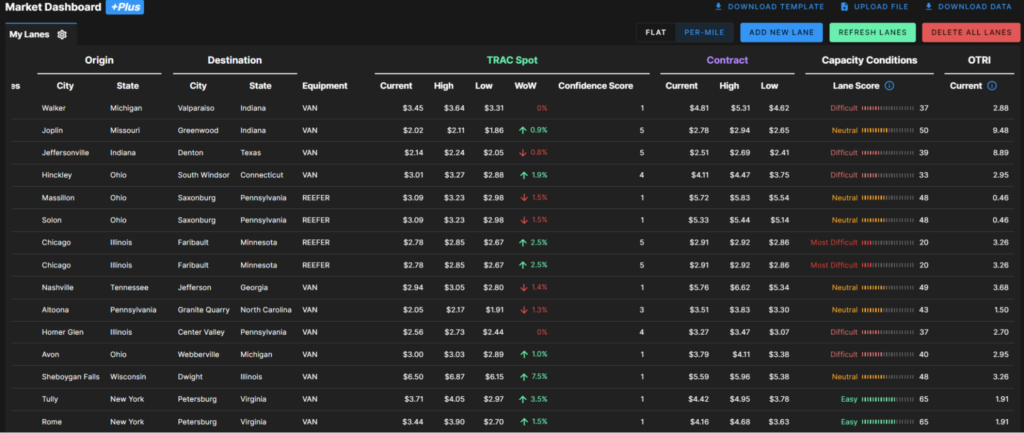
Freight Forecasting host Michael Vincent shows SONAR users how to build out market tables that will give quick insights into market conditions on a tactical level.
Watch the episode below:
In addition to showing you how to build a market table, you’ll learn to analyze the data through charting and comparing the different indices. Michael gives information on SONAR’s Outbound Tender Rejection Index (OTRI), Inbound Tender Rejection Index (ITRI), the HAUL Index, etc. You will learn how to use them to compare data for dry van, reefer and flatbed trailers, as well as truckload and less-than-truckload. In addition, Michael will illustrate SONAR’s volatility tables.
With Michael’s help, you will get a better understanding of SONAR’s versatility and ease of use. While SONAR has billions of data points, 150,000 indices and can provide local, national and even global information, it doesn’t have to be hard to learn or use. With Michael’s help – and the help of FreightWaves Customer Support team, you can become adept at using SONAR very quickly.
And what makes SONAR so special is the ability to customize it for just your uses. You may need to know about air or ship cargo coming from Shanghai to Los Angeles. Or you need information on tomorrow’s diesel prices in 10 key U.S. markets. Or perhaps all you care about are the trucking lanes from Chicago to your key markets. That customization is what makes SONAR so very special – and can make it so useful to your business. Again, FreightWaves Customer Support can walk you through all that you need to get you up and running, or to make you a SONAR expert.
Know more, faster – and find just what you need with SONAR!